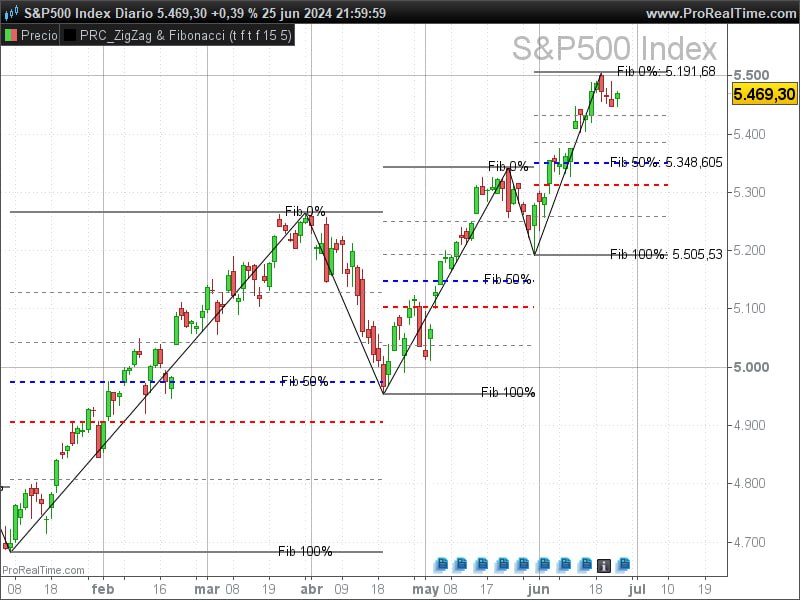
The Zigzag & Fibonacci Levels indicator is a powerful tool that combines the identification of market reversal points through the Zigzag and the projection of Fibonacci levels to anticipate possible support and resistance zones.
This article explores in detail how this indicator works, how to configure it, and how it can benefit traders in their technical analysis.
Description of the Zigzag Indicator
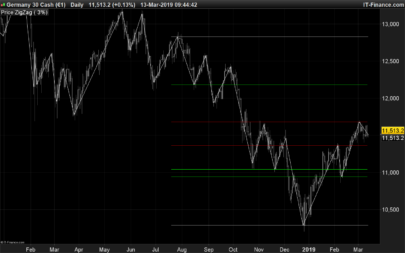
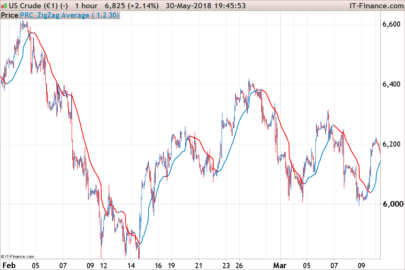
The Zigzag indicator is fundamental in technical analysis for identifying trend changes by eliminating market “noise.” This indicator draws lines that connect significant high and low points, filtering minor movements based on a percentage variation or absolute highest or lowest value.
Key Parameters:
- ZZpercent: Defines the method of Zigzag calculation (percentage or value).
- prd: Period for calculating high and low values.
- percent: Percentage change for Zigzag in percentage mode.
|
1 2 3 4 |
// Inputs ZZpercent=1 prd=15 percent=5 |
Calculation of Pivots High & Low
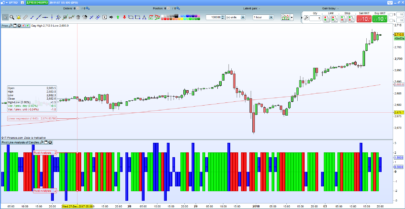
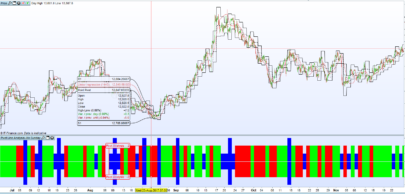
The indicator identifies high (pivots high) and low (pivots low) points in two ways:
- Percent Mode: Uses percentage variation to determine pivots.
- Value Mode: Uses the highest and lowest values over a specified period (prd).
|
1 2 3 4 5 6 7 8 |
if ZZpercent then zz = zigzag[percent](close) ph = zz<zz[1] and zz[1]>zz[2] pl = zz>zz[1] and zz[1]<zz[2] else ph = high=highest[prd](high) pl = low=lowest[prd](low) endif |
Calculation of Direction and Direction Changes
Once the pivots are identified, the indicator determines the current trend direction:
- dir = 1 indicates an uptrend.
- dir = -1 indicates a downtrend.
|
1 2 3 4 5 6 7 8 |
if ph and pl=0 then dir=1 elsif pl and ph=0 then dir=-1 else dir=dir endif dirchanged=dir<>dir[1] |
Arrays for Each Pivot
The indicator stores the pivots and their direction in arrays, allowing precise tracking of the Zigzag points:
|
1 2 3 4 5 6 7 8 9 10 11 12 13 14 15 16 17 18 19 20 21 22 23 24 25 26 27 28 29 30 31 32 33 34 35 |
if ph or pl then if dirchanged then if dir=1 and not ZZpercent then $zigzag[t+1]=highest[prd](high) $zigzagidx[t+1]=barindex $dir[t+1]=1 t=t+1 elsif dir=-1 and not ZZpercent then $zigzag[t+1]=lowest[prd](low) $zigzagidx[t+1]=barindex $dir[t+1]=-1 t=t+1 elsif dir=1 and ZZpercent then $zigzag[t+1]=zz[1] $zigzagidx[t+1]=barindex[1] $dir[t+1]=1 t=t+1 elsif dir=-1 and ZZpercent then $zigzag[t+1]=zz[1] $zigzagidx[t+1]=barindex[1] $dir[t+1]=-1 t=t+1 endif else if not ZZpercent then if dir=1 and highest[prd](high)> $zigzag[t] then $zigzag[t]=highest[prd](high) $zigzagidx[t]=barindex elsif dir=-1 and lowest[prd](low)< $zigzag[t] then $zigzag[t]=lowest[prd](low) $zigzagidx[t]=barindex endif endif endif endif |
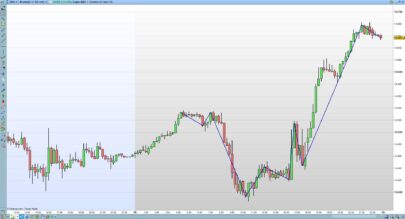
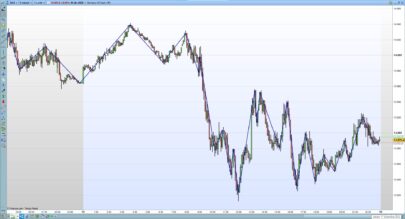
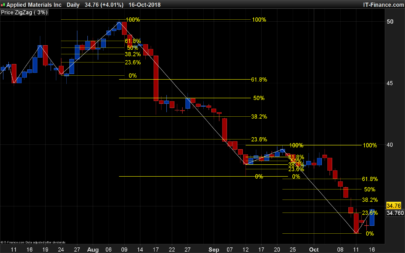
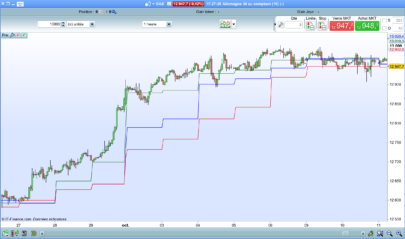
Drawing Zigzag Segments and Fibonacci Levels
The indicator draws the Zigzag segments and calculates the Fibonacci levels based on the trend direction:
|
1 2 3 4 5 6 7 8 9 10 11 12 13 14 15 16 17 18 19 20 21 22 23 24 25 26 27 28 29 30 31 32 33 34 35 36 37 38 39 40 41 42 |
if islastbarupdate then drawsegment($zigzagidx[max(0,t-1)],$zigzag[max(0,t-1)],$zigzagidx[t],$zigzag[t]) if $dir[t]=1 then fib0=$zigzag[max(0,t-1)] fib100=$zigzag[t] diff=fib100-fib0 fib0236=fib100-diff*0.236 fib0382=fib100-diff*0.382 fib0500=fib100-diff*0.500 fib0618=fib100-diff*0.618 fib0786=fib100-diff*0.786 drawsegment($zigzagidx[max(0,t-1)],fib0,barindex+10,fib0)style(line,2)coloured("grey") drawsegment($zigzagidx[max(0,t-1)],fib0236,barindex+10,fib0236)style(dottedline,1)coloured("grey") drawsegment($zigzagidx[max(0,t-1)],fib0382,barindex+10,fib0382)style(dottedline,1)coloured("grey") drawsegment($zigzagidx[max(0,t-1)],fib0500,barindex+10,fib0500)style(dottedline,2)coloured("blue") drawsegment($zigzagidx[max(0,t-1)],fib0618,barindex+10,fib0618)style(dottedline,2)coloured("red") drawsegment($zigzagidx[max(0,t-1)],fib0786,barindex+10,fib0786)style(dottedline,1)coloured("grey") drawsegment($zigzagidx[max(0,t-1)],fib100,barindex+10,fib100)style(line,2)coloured("grey") drawtext("Fib 0%: #fib0#",barindex+10,fib100+0.05*atr) drawtext("Fib 50%: #fib0500#",barindex+10,fib0500+0.05*atr) drawtext("Fib 100%: #fib100#",barindex+10,fib0+0.05*atr) elsif $dir[t]=-1 then fib0=$zigzag[t] fib100=$zigzag[max(0,t-1)] diff=fib100-fib0 fib0236=fib0+diff*0.236 fib0382=fib0+diff*0.382 fib0500=fib0+diff*0.500 fib0618=fib0+diff*0.618 fib0786=fib0+diff*0.786 drawsegment($zigzagidx[max(0,t-1)],fib0,barindex+10,fib0)style(line,2)coloured("grey") drawsegment($zigzagidx[max(0,t-1)],fib0236,barindex+10,fib0236)style(dottedline,1)coloured("grey") drawsegment($zigzagidx[max(0,t-1)],fib0382,barindex+10,fib0382)style(dottedline,1)coloured("grey") drawsegment($zigzagidx[max(0,t-1)],fib0500,barindex+10,fib0500)style(dottedline,2)coloured("blue") drawsegment($zigzagidx[max(0,t-1)],fib0618,barindex+10,fib0618)style(dottedline,2)coloured("red") drawsegment($zigzagidx[max(0,t-1)],fib0786,barindex+10,fib0786)style(dottedline,1)coloured("grey") drawsegment($zigzagidx[max(0,t-1)],fib100,barindex+10,fib100)style(line,2)coloured("grey") drawtext("Fib 0%: #fib0#",barindex+10,fib0+0.05*atr) drawtext("Fib 50%: #fib0500#",barindex+10,fib0500+0.05*atr) drawtext("Fib 100%: #fib100#",barindex+10,fib100+0.05*atr) endif endif |
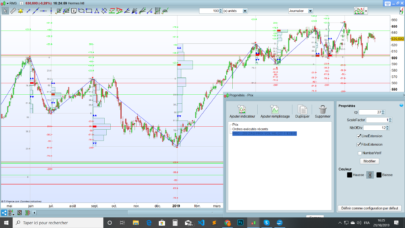
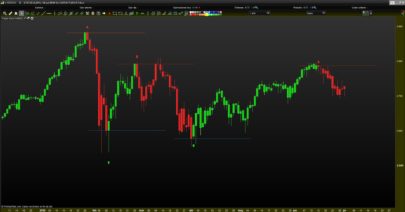
Visualization Configuration
The indicator allows customizing the visualization of past Fibonacci levels and adjusting the colors and styles of the lines for better visual interpretation.
Conclusion
The Zigzag & Fibonacci Levels indicator combines two powerful tools of technical analysis to provide a clear view of key market levels. By using this indicator, traders can more accurately identify reversal points and anticipate possible support and resistance zones.
ZigZag & Fibonacci Levels Code:
|
1 2 3 4 5 6 7 8 9 10 11 12 13 14 15 16 17 18 19 20 21 22 23 24 25 26 27 28 29 30 31 32 33 34 35 36 37 38 39 40 41 42 43 44 45 46 47 48 49 50 51 52 53 54 55 56 57 58 59 60 61 62 63 64 65 66 67 68 69 70 71 72 73 74 75 76 77 78 79 80 81 82 83 84 85 86 87 88 89 90 91 92 93 94 95 96 97 98 99 100 101 102 103 104 105 106 107 108 109 110 111 112 113 114 115 116 117 118 119 120 121 122 123 124 125 126 127 128 129 130 131 132 133 134 135 136 137 138 139 140 141 142 143 144 145 146 147 148 149 150 151 152 153 154 155 156 157 158 159 160 161 162 163 164 165 166 167 168 169 170 171 172 173 174 |
//----------------------------------------------------------------------------// //PRC_ZigZag & Fibonacci levels //version = 0 //26.06.24 //Iván González @ www.prorealcode.com //Sharing ProRealTime knowledge //----------------------------------------------------------------------------// //-----Inputs-----------------------------------------------------------------// ZZpercent=1 //Boolean//Method for pivot points calculation prd=15 //Periods for Donchian Channel and pivot calculation percent=5 //Percentage for zigzag calculation showpastFib=1 //Boolean//shows all zigzag and Fibo levels showDN=1 //Boolean//shows fibo levels in a Uptrend ShowUP=0 //Boolean//shows fibo levels in a Downtrend //----------------------------------------------------------------------------// atr=averagetruerange[14](close) //Only drawing porpouse //----------------------------------------------------------------------------// //-----Pivots High&Low--------------------------------------------------------// if ZZpercent then //-----Mode Percent--------------------------------------------------------// zz = zigzag[percent](close) ph = zz<zz[1] and zz[1]>zz[2] pl = zz>zz[1] and zz[1]<zz[2] //-----Mode Highest/lowest Values------------------------------------------// else ph = high=highest[prd](high) pl = low=lowest[prd](low) endif //----------------------------------------------------------------------------// //-----Direction Calculation--------------------------------------------------// if ph and pl=0 then dir=1 elsif pl and ph=0 then dir=-1 else dir=dir endif dirchanged=dir<>dir[1] //----------------------------------------------------------------------------// //-----Calculate Arrays for each pivot----------------------------------------// if ph or pl then if dirchanged then if dir=1 and not ZZpercent then $zigzag[t+1]=highest[prd](high) $zigzagidx[t+1]=barindex $dir[t+1]=1 t=t+1 elsif dir=-1 and not ZZpercent then $zigzag[t+1]=lowest[prd](low) $zigzagidx[t+1]=barindex $dir[t+1]=-1 t=t+1 elsif dir=1 and ZZpercent then $zigzag[t+1]=zz[1] $zigzagidx[t+1]=barindex[1] $dir[t+1]=1 t=t+1 elsif dir=-1 and ZZpercent then $zigzag[t+1]=zz[1] $zigzagidx[t+1]=barindex[1] $dir[t+1]=-1 t=t+1 endif else if not ZZpercent then if dir=1 and highest[prd](high)> $zigzag[t] then $zigzag[t]=highest[prd](high) $zigzagidx[t]=barindex elsif dir=-1 and lowest[prd](low)< $zigzag[t] then $zigzag[t]=lowest[prd](low) $zigzagidx[t]=barindex endif endif endif endif //----------------------------------------------------------------------------// //-----Drawing conditions-----------------------------------------------------// if islastbarupdate then //-----Last Zig and Fibonacci Levels---------------------------------------// drawsegment($zigzagidx[max(0,t-1)],$zigzag[max(0,t-1)],$zigzagidx[t],$zigzag[t]) if $dir[t]=1 then //-----Calculation when trend Up----------------------------------------// fib0=$zigzag[max(0,t-1)] fib100=$zigzag[t] diff=fib100-fib0 fib0236=fib100-diff*0.236 fib0382=fib100-diff*0.382 fib0500=fib100-diff*0.500 fib0618=fib100-diff*0.618 fib0786=fib100-diff*0.786 drawsegment($zigzagidx[max(0,t-1)],fib0,barindex+10,fib0)style(line,2)coloured("grey") drawsegment($zigzagidx[max(0,t-1)],fib0236,barindex+10,fib0236)style(dottedline,1)coloured("grey") drawsegment($zigzagidx[max(0,t-1)],fib0382,barindex+10,fib0382)style(dottedline,1)coloured("grey") drawsegment($zigzagidx[max(0,t-1)],fib0500,barindex+10,fib0500)style(dottedline,2)coloured("blue") drawsegment($zigzagidx[max(0,t-1)],fib0618,barindex+10,fib0618)style(dottedline,2)coloured("red") drawsegment($zigzagidx[max(0,t-1)],fib0786,barindex+10,fib0786)style(dottedline,1)coloured("grey") drawsegment($zigzagidx[max(0,t-1)],fib100,barindex+10,fib100)style(line,2)coloured("grey") drawtext("Fib 0%: #fib0#",barindex+10,fib100+0.05*atr) drawtext("Fib 50%: #fib0500#",barindex+10,fib0500+0.05*atr) drawtext("Fib 100%: #fib100#",barindex+10,fib0+0.05*atr) elsif $dir[t]=-1 then //-----Calculation when trend Down--------------------------------------// fib0=$zigzag[t] fib100=$zigzag[max(0,t-1)] diff=fib100-fib0 fib0236=fib0+diff*0.236 fib0382=fib0+diff*0.382 fib0500=fib0+diff*0.500 fib0618=fib0+diff*0.618 fib0786=fib0+diff*0.786 drawsegment($zigzagidx[max(0,t-1)],fib0,barindex+10,fib0)style(line,2)coloured("grey") drawsegment($zigzagidx[max(0,t-1)],fib0236,barindex+10,fib0236)style(dottedline,1)coloured("grey") drawsegment($zigzagidx[max(0,t-1)],fib0382,barindex+10,fib0382)style(dottedline,1)coloured("grey") drawsegment($zigzagidx[max(0,t-1)],fib0500,barindex+10,fib0500)style(dottedline,2)coloured("blue") drawsegment($zigzagidx[max(0,t-1)],fib0618,barindex+10,fib0618)style(dottedline,2)coloured("red") drawsegment($zigzagidx[max(0,t-1)],fib0786,barindex+10,fib0786)style(dottedline,1)coloured("grey") drawsegment($zigzagidx[max(0,t-1)],fib100,barindex+10,fib100)style(line,2)coloured("grey") drawtext("Fib 0%: #fib0#",barindex+10,fib0+0.05*atr) drawtext("Fib 50%: #fib0500#",barindex+10,fib0500+0.05*atr) drawtext("Fib 100%: #fib100#",barindex+10,fib100+0.05*atr) endif //-----Draw all Fibonacci levels and ZigZag-----------------------------------------// if showpastFib then for i=t-1 downto 1 do //----------------------------------------------------------------------------// drawsegment($zigzagidx[max(0,i-1)],$zigzag[max(0,i-1)],$zigzagidx[i],$zigzag[i]) //-----Show Fibonacci when trend Up-------------------------------------------// if $dir[i]=1 and showDN then fib0=$zigzag[i-1] fib100=$zigzag[i] diff=fib100-fib0 fib0236=fib100-diff*0.236 fib0382=fib100-diff*0.382 fib0500=fib100-diff*0.500 fib0618=fib100-diff*0.618 fib0786=fib100-diff*0.786 drawsegment($zigzagidx[i-1],fib0,$zigzagidx[i+1],fib0)style(line,2)coloured("grey") drawsegment($zigzagidx[i-1],fib0236,$zigzagidx[i+1],fib0236)style(dottedline,1)coloured("grey") drawsegment($zigzagidx[i-1],fib0382,$zigzagidx[i+1],fib0382)style(dottedline,1)coloured("grey") drawsegment($zigzagidx[i-1],fib0500,$zigzagidx[i+1],fib0500)style(dottedline,2)coloured("blue") drawsegment($zigzagidx[i-1],fib0618,$zigzagidx[i+1],fib0618)style(dottedline,2)coloured("red") drawsegment($zigzagidx[i-1],fib0786,$zigzagidx[i+1],fib0786)style(dottedline,1)coloured("grey") drawsegment($zigzagidx[i-1],fib100,$zigzagidx[i+1],fib100)style(line,2)coloured("grey") drawtext("Fib 0%",$zigzagidx[i],fib100+0.05*atr) drawtext("Fib 50%",$zigzagidx[i],fib0500+0.05*atr) drawtext("Fib 100%",$zigzagidx[i],fib0+0.05*atr) //-----Show Fibonacci when trend Down-----------------------------------------// elsif $dir[i]=-1 and ShowUP then fib0=$zigzag[i] fib100=$zigzag[i-1] diff=fib100-fib0 fib0236=fib0+diff*0.236 fib0382=fib0+diff*0.382 fib0500=fib0+diff*0.500 fib0618=fib0+diff*0.618 fib0786=fib0+diff*0.786 drawsegment($zigzagidx[i-1],fib0,$zigzagidx[i+1],fib0)style(line,2)coloured("grey") drawsegment($zigzagidx[i-1],fib0236,$zigzagidx[i+1],fib0236)style(dottedline,1)coloured("grey") drawsegment($zigzagidx[i-1],fib0382,$zigzagidx[i+1],fib0382)style(dottedline,1)coloured("grey") drawsegment($zigzagidx[i-1],fib0500,$zigzagidx[i+1],fib0500)style(dottedline,2)coloured("blue") drawsegment($zigzagidx[i-1],fib0618,$zigzagidx[i+1],fib0618)style(dottedline,2)coloured("red") drawsegment($zigzagidx[i-1],fib0786,$zigzagidx[i+1],fib0786)style(dottedline,1)coloured("grey") drawsegment($zigzagidx[i-1],fib100,$zigzagidx[i+1],fib100)style(line,2)coloured("grey") drawtext("Fib 0%",$zigzagidx[i],fib0+0.05*atr) drawtext("Fib 50%",$zigzagidx[i],fib0500+0.05*atr) drawtext("Fib 100%",$zigzagidx[i],fib100+0.05*atr) endif next endif endif return |
Share this
No information on this site is investment advice or a solicitation to buy or sell any financial instrument. Past performance is not indicative of future results. Trading may expose you to risk of loss greater than your deposits and is only suitable for experienced investors who have sufficient financial means to bear such risk.
ProRealTime ITF files and other attachments :
Find other exclusive trading pro-tools on ![]()
PRC is also on YouTube, subscribe to our channel for exclusive content and tutorials
Ivan can you please explain a line of code that is puzzling me. This is line 37 . As I understand, either the value of dir is updated on line 33 or 35 or it remains unchanged so what can line 37 be used for? Thank you for your explanations and thank you for all the codes that you share here with us. Gabriel