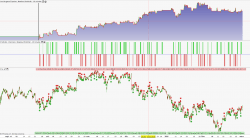
ProOrder Breakout on French cac40 my account performances
Forums › ProRealTime English forum › General trading discussions › ProOrder Breakout on French cac40 my account performances
- This topic has 47 replies, 14 voices, and was last updated 5 years ago by
 Vonasi.
-
-
12/04/2015 at 10:12 AM #2693
In this topic i will post the performance of the automated trading strategy “Breakout ProOrder” i am actually trading on one of my personnal account, dedicated to this system.
I am related to this blog article : ./blog/automated-breakout-trading-strategy-french-cac40/ where i explain much more how it’s working and why i am using it.
This trading strategy came from the French ProOrder official documentation.
Since inception in late Sept.2015, i gain almost 38.2% on my small 1000€ account.
September ’15: +4.7%
October ’15: +35%
November ’15: +15.3%
01/19/2016 at 9:58 AM #2904December 2015 performance : +24.43%
December was again a good month for the strategy, it performs well as the CAC40 indice did nice intraday moves that fit our strategy : let the profit run and cut the losses very quickly.
This is what my mini-account performance look a like presently. Damn good since my first post to introduce it :
Since the beginning of January, the performance is almost 9%.
01/19/2016 at 11:22 AM #2907I have made some stats works on past performance with the help of my great friend Excel.
I have exported backtest data to a worksheet and made some statistical formulas to get some interesting values : average of the positive and negative deviation of the mean.
Within these values, we get a reliable view of what is the behaviour of the strategy in the past.
The results are of course something we already known as the positive deviation is greater than the negative one. If not, the strategy would have not made so good performance in the past.To limit Excel memory consumption i have limited the statistical calculation on “only” 1000 trades. Also, because Excel doesnt allow to draw more than 255 lines in the same graph, i have also limited the simulation to 255 random strategies simulation.
- Trades are simulated this way, for each simulated day :
Profitable trades are set between 0 and the average positive deviation
Negative trades are set between the average negative deviation and 0
I then introduced 2 random criteria to let each simulated strategy to choose if a trade is trigger or not and also if it is a profitable day or not.
This way, I can scramble each individual strategy behaviour by playing this 2 criteria.What a big Excel spreadsheet:
01/19/2016 at 11:45 AM #2911Here are the results of 255 simulated strategies made of :
60% of days are traded with 50% of profitable days :
Strategies results distribution are quiet centric, it is a good result.
60% of days are traded with 40% of profitable days :
Even with 40% of profitable days, these 255 simulated strategies give more positive distribution than negative one. Good point, even if not every simulation are profitable.
80% of days are traded with 40% of profitable days :
Since it is a breakout strategy on a 15 minutes timeframe, we can assume that most of the year, the stop orders will be trigger. With 80% of days that are traded, i think that it is a good criteria.
(Simulations are made with 2 standards mini contracts).
There a lot of other statistical simulations that could be made, i’m gonna do some Kurtosis now to give confidence interval of probabilistic future performances.
02/02/2016 at 4:16 PM #301703/01/2016 at 9:33 AM #333603/22/2016 at 9:25 PM #4128Hello Nicolas,
How do you get the curves of “trading simulation”?
What software?
Thank you03/23/2016 at 3:14 PM #415703/29/2016 at 8:11 AM #4549Between 2 other things I’m actually playing with Excel to make proper and understandable report for Probacktest results analysis. Confidence intervals give us a better clear view of what could happen in the future while trading the strategy analysed in the Monte Carlo matrix.
For this example, we can observe that 25% of the whole random strategies results are settled between 70-90% same performance, that is quiet good. (see image attached).
03/30/2016 at 12:42 PM #462203/30/2016 at 1:00 PM #4627Definitely! I know some people have already made it. I didn’t get enough time myself to investigate more on other instruments, but we could expect some kind of good performances too. The prorealtime code for this strategy is free and available to everyone, so maybe someone with a nice sense of sharing will post here his own improved version..
04/14/2016 at 3:02 PM #538504/14/2016 at 5:03 PM #5395Hello adelrio, March performance were negative (-8.09%), but still at 49.04% since inception.
April made a good start, we are almost at +6% actually.
If the intraday market is in range, we accumulate stop loss executed with minimal loss. But if market make good moves like this recent days, profit is larger. Cut the loss quickly and let the profit run is the best part of this strategy.
04/14/2016 at 7:15 PM #540105/11/2016 at 10:34 AM #6784Hi, I’m new… Hello everyone… 🙂
one question… what about commision… what impact do they have on this system? Could it be a good idea to use it with CFD contracts?
Regards
David
- Trades are simulated this way, for each simulated day :
-
AuthorPosts
Find exclusive trading pro-tools on 


