Do my new automated strategy worth to be traded? Is it better than an old “buy and hold” strategy? Let’s see how we can make comparison in this blog article.
Buy and Hold strategy, what is it?
Buy and hold strategy is nothing more than buy an instrument and hold it without doing anything than watch it grows your initial balance. It’s pure passive investment and it’s still something largely “traded” for retirement plans for example.
It’s sometimes more profitable than doing more than one order operation on the same share and that’s the reason it is often used as a comparison to fully automated trading strategies.
How to compare result with buy and hold?
Let’s say that we have a simple strategy made of breakout of the recent highest high with a 200 period moving average acting as a trend filter. Orders are closed with price crossing under more recent lowest low.
|
1 2 3 4 5 6 7 8 9 10 11 12 13 14 15 16 17 18 19 20 |
defparam cumulateorders=false //highest high large period hh = highest[100](high) //lowest low short period ll = lowest[35](low) //trend filter trend = close > average[200] //buy trigger if close crosses over hh[1] and trend then BUY 1 SHARE AT MARKET endif //exit position if close crosses under ll[1] then SELL AT MARKET endif |
Of course this kind of compare is only possible with long only strategies, because we are comparing with passive investment, no short positions could be used.
This simple strategy produce gain because trend is bullish since a while. To compare with buy and hold, we must use the exact same conditions than the strategy itself:
- same initial capital
- same start date for investment
- same price entry as the first trade
What we want here is to set a new indicator that can draw a curve of the buy and hold equity directly over the gain/loss equity produce by the backtest. This way, comparison should be easier.
Let’s define the same parameters in a new indicator called “buyandhold”:
|
1 2 3 |
balance = 10000 mylot = 1 startdate = 19851125 |
Once these parameters are defined, we could do some calculation:
|
1 2 3 4 5 6 7 8 9 10 11 12 13 14 |
once firstclose = 0 if date>=startdate then if firstclose = 0 then //save the current close once when the comparison start firstclose = close endif //calculate buy and hold with pointvalue and pointsize of the current share buyandhold = balance+(((close-firstclose)*pointvalue)*mylot)/pointsize else //if the displayed date is previous from the startdate, let's draw the buy and hold curve as the balance buyandhold = balance endif RETURN buyandhold coloured(255,128,0) |
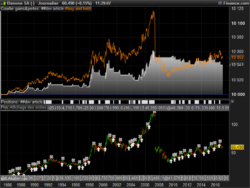
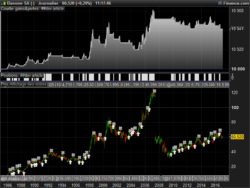
Here is what we got on the equity curve chart, when the indicator is applied on it (use the wrench on the upper left side of the window):
 As you can see in this example, buy and hold is better investment until a sudden gap crash was observed in mid 2007 (orange curve).
Done. This code snippet is a great tool for automated trading development, hope you’ll find it useful!
Of course, comparison should also be made on many others criteria such as drawdown, fees, risk/reward ratio, etc. but it were not the purpose of this approach.


Lo podrías poner todo en un archivo itf para testearlo. Gracias
Sólo copie / pegue todos los códigos y ya está hecho 🙂
Great code again!! Thanks!
This is awesome, thanks!
Brilliant idea, and here’s an interesting video presentation by Matlabs/Mathworks on Commodity Strategies compared to Buy and Hold using Momentum Indicators such as SMA Slope and SMA Difference and then looking at lagging momentum commodities and buying them to profit as they catch up with the other commodities in their sector (Energies, Grains, Softs and Metals) :
https://uk.mathworks.com/videos/commodities-trading-with-matlab-81986.html
Hi Nicolas,
This code did not work for me;
this one worked:
balance = 10000
mylot = 1
startdate = 20100930
if date=startdate then
////save the current close once when the comparison start
firstclose = close
elsif date>startdate then
////calculate buy and hold with pointvalue and pointsize of the current share
buyandhold =balance *(close/firstclose)*pointvalue*mylot/pointsize
else
////if the displayed date is previous from the startdate, let’s draw the buy and hold curve as the balance
buyandhold = balance
endif
RETURN buyandhold coloured(255,128,0)
@Nicolas
Really useful tool, thanks!
Is there a way of plotting the ratio gain/loss on the chart of the automated strategy in order to see it at first glance (without opening the detailed report of the strategy) ?
Yes.
@Nicolas
Sorry, I didn’t see your reply. Could you tell me how to plot the ratio gain/loss directly on the chart of an automated strategy ? Is there a specific command that I can insert in the trading system or is there any parameter in the configuration of the sofware that I need to modify?
Thanks in advance
Gabriele
Bonjour Nicolas (et les autres),
Y a t’il la possibilité de le coder en backtest plutôt qu’en indicateur de manière à voir le drawdown.
J’ai fait ce code en entrant manuellement la date de sortie (ici le 30/10/2019), mais y aurait il moyen de l’améliorer pour qu’il s’adapte tout seul à la date de sortie (fonction du jour ou j’ouvre le backtest)?
Merci par avance de votre aide
Le code :
Defparam cumulateorders = false
Capital=10000
n=Capital/close
n=round(n)
IF Not OnMarket THEN
BUY n shares AT MARKET
ENDIF
IF date=20191030 THEN
SELL AT MARKET
ENDIF
Hi
Looks like RETURN doesn’t work and needs to be replaced by GRAPH.
I use this code
once firstclose = 0
once firstn = 0
if firstclose = 0 and firstn = 0 then
buyandhold = CAPITALInit
else
buyandhold = CAPITALInit+(close-firstclose)*firstn
endif
GRAPH buyandhold coloured(255,128,0)
And I initiate firstclose and firstn just after the BUY statement if both variable equals to 0