Documentation / Indicators

Return value of the MACD line indicator over S and L period of selected price.

Syntax:


Example:


MACDsignal

ProRealTime v11

Return the MACD signal line value.

Syntax:

Where:

  • fastPeriod= fast EMA period used by MACD (default is 12 period)
  • slowPeriod= slow EMA period used by MACD (default is 26 period)
  • SignalPeriod= period used to calculate the MACDSignal line (see description below), default period is 9

(more…)

Return value of the Mass Index technical indicator over N periods.

Syntax:

Calculation:

MassIndex = Summation[N](ExponentialAverage[N](high – low) / ExponentialAverage[N](ExponentialAverage[N](high-low))) (more…)

Return value of the Momentum technical indicator of the Nth bar : (close – close of the N-th last bar).

Syntax:

Calculation:

It is obtained by substracting the x days before Close from today’s Close. X is the parameter associated with Momentum. (more…)

Return value of the Money Flow indicator, over the last N periods for selected price. Values are bounded between -1 and 1.

Syntax:


Example:


Return value of the Money Flow Index indicator, over the last N periods.

Syntax:

Calculation :

Money Flow = [typical price * volume] = [(H+L+C)/3 * volume]

If the median price > yesterday’s median price then Money Flow is a positive flow.

If the median price < yesterday’s median price then Money Flow is a negative flow.

Then calculate the money ratio :

MR = (MF+ / MF-)

MFI = 100 – [100 / (1+ MR)]

(more…)

Return the On balance volume indicator value of the selected price.

Syntax:


Example:


Give the positive volume index value, also known as PVI technical indicator of selected price. Near volumes informations of the instrument.

Syntax:

Calculation :

If today’s Volume > yesterday’s Volume then PVI = yesterday’s PVI + (today’s close – yesterday’s close) / [yesterday’s close * yesterday’s PVI]


If today’s Volume < yesterday’s Volume then PVI = yesterday’s PVI.

(more…)

Return value of the Price Oscillator technical indicator of momentum for selected price.

The S parameter is the short term moving average and L as the long term one.

Syntax:

Calculation :

The price oscillator is calculated by subtracting a short moving average by a long one. In its percentage form, the result is divided by the short moving average and multiplied by 100. The parameters are the number of days of both moving averages.

Interpretation :

Buy/Sell opportunities occur when the oscillator crosses the 0 level.


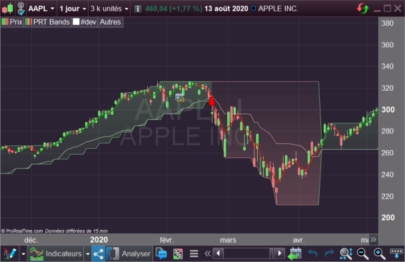
Returns the PRT Bands lowest band.

Syntax:

Example: 
Plot a down arrow above the candlestick when the Close crosses under the lowest band


Top