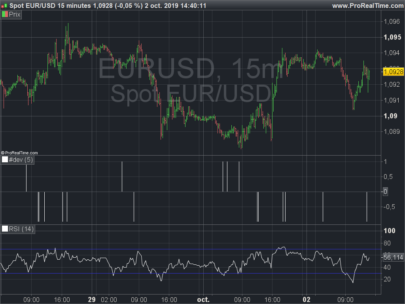
Return signals of the internal RSI divergences indicator of the platform.
Syntax:
|
1 |
DivergenceRSI[RSIperiod, LowRSIthreshold, HighRSIthreshold, Bars](price) |
Where:
RSIperiod = Relative Strength Index (RSI) indicator period of calculation, default is 5 periods
LowRSIthreshold = Lowest bound of the RSI indicator, default is 30
HighRSIthreshold = Highest bound of the RSI indicator, default is 70
Bars = Bars quantity to detect a potential divergences, default is 20
RSI DIVERGENCE Calculation: This indicator detects bullish and bearish divergences between price and the RSI. A bullish divergence occurs when the stock price makes new lows while the indicator starts to climb upward. A bearish divergence occurs when the stock price makes new highs while the indicator starts to go lower.
Interpretation: The divergences indicate a slowdown of the current trend and a probability of a reversal. If a bullish divergence is detected this indicator returns +1 (green histogram). If a bearish divergence is detected, the indicator returns -1 (red histogram). If no divergence is detected, the indicator returns 0.
Tip: If looking at a price chart, an RSI chart and an RSI Divergence chart, make sure that you have set the parameters of the RSI and RSI Divergence to the same levels (ex: 14).
Example:
|
1 2 3 |
i = DivergenceRSI[5,30,70,20](close) return i style(histogram) |
 DivergenceRSI
I can’t understand the meaning of this indicator. I mean how to read or understand the output? For example the last two hisogramm on the right?
A bullish divergence is marked with a +1 signal, while a bearish divergence reversal is marked with a -1 signal.