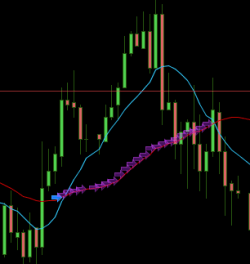
Graphical instruction to draw an horizontal arrow pointing to the right side of the chart.
Syntax:
|
1 |
DRAWARROW(x1,y1) COLOURED(R,V,B,a) |
where “x1” is the Barindex and “y1” the price or the vertical axis value.
Example :
|
1 2 3 4 5 6 7 8 9 10 11 12 13 14 15 |
fast = average[10](close) slow = average[30](close) //first arrow is blueish if fast crosses over slow then cross = slow[1] DRAWARROW(barindex-1, slow[1]) COLOURED(0,100,255,255) endif //next arrows are purple and semi transparent if fast>slow AND slow<>cross then DRAWARROW(barindex, slow) COLOURED(151,17,228,100) endif RETURN |
 DRAWARROW