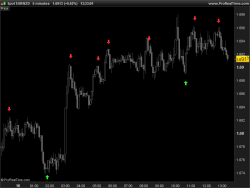
Draw a downside arrow on chart on x,y coordinate.
Syntax:
|
1 |
DRAWARROWDOWN(x1,y1) COLOURED(R,V,B,a) |
Coloured is optional.
Example :
|
1 2 3 4 5 6 7 8 9 10 11 |
sto = Stochastic[10,3](close) signal = average[5](sto) rge = averagetruerange[10](close) if sto[1]>80 and sto crosses under signal then DRAWARROWDOWN(barindex[1],high[1]+rge/2)coloured(255,10,10) elsif sto[1]<20 and sto crosses over signal then DRAWARROWUP(barindex[1],low[1]-rge/2)coloured(10,255,10) endif RETURN |
 DRAWARROWDOWN
Hi, is it possible to change size of the arrow? Thank you.