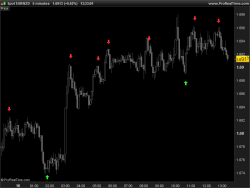
Draw an upside arrow on chart on x,y coordinate.
Syntax:
|
1 |
DRAWARROWUP(x1,y1) COLOURED(R,V,B,a) |
Coloured is optional.
Example :
|
1 2 3 4 5 6 7 8 9 10 11 |
sto = Stochastic[10,3](close) signal = average[5](sto) rge = averagetruerange[10](close) if sto[1]>80 and sto crosses under signal then DRAWARROWDOWN(barindex[1],high[1]+rge/2)coloured(255,10,10) elsif sto[1]<20 and sto crosses over signal then DRAWARROWUP(barindex[1],low[1]-rge/2)coloured(10,255,10) endif RETURN |
 DRAWARROWUP
I can’t find option to increase size of arrow, like what you can do with text. Somebody ideas?
Symbols have only a default size which cannot be increased or decreased. You can try to play with ASCII characters with DRAWTEXT instead.
merci nicolas pour toutes les infos que tu poste! je suis un pur débutant est je suis arrivé a coder un peut grâce a tes poste!
bonjour comment faire pour supprimer certaine flèches qu’on ne veut pas mais qu’il sont apparue dut au signal merci!