Draw custom OHLC candlestick.
Syntax:
|
1 |
DRAWCANDLE(open,high,low,close) COLOURED(R,G,B) BORDERCOLOR(R,G,B) |
The open, high, low and close value can be set by any custom variables.
Coloured and Bordercolor instructions are optional, when not defined the colors will be the default price one.
Example 1:
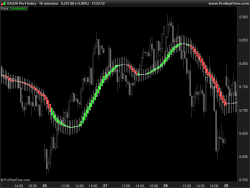
Smooth Heiken Ashi candlestick
|
1 2 3 4 5 6 7 8 9 10 11 12 13 14 15 16 17 18 19 20 21 22 23 24 25 26 |
//Smooth Heiken Ashi candlestick period = 20 if barindex>period then avgO = average[period](open) avgH = average[period](high) avgL = average[period](low) avgC = average[period](close) HAClose = (avgO+avgH+avgL+avgC) /4 HAOpen = (HAOpen[1]+HAClose[1]) / 2 HAHigh = MAX(avgH,MAX(HAOpen,HAClose)) HALow = MIN(avgL,MIN(HAOpen,HAClose)) IF avgO <= avgC THEN // Green candlestick DRAWCANDLE(HAOpen,HAHigh,HALow,HAClose) COLOURED(0,255,0) ELSE // Red candlestick DRAWCANDLE(HAOpen,HAHigh,HALow,HAClose) COLOURED(255,0,0) ENDIF endif RETURN |
Example 2:
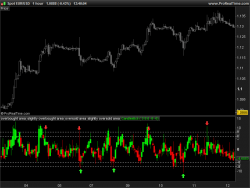
Value chart indicator :
|
1 2 3 4 5 6 7 8 9 10 11 12 13 14 15 16 17 18 19 20 21 22 23 24 25 26 27 28 29 30 31 32 33 34 35 36 |
//parameters : //ExtDepth = 5 //Overbought = 8 //SlightlyOverbought = 6 //Oversold = -8 //SlightlyOversold = -6 if barindex>ExtDepth then sumHigh = summation[ExtDepth](high) sumLow = summation[ExtDepth](low) floatingaxis = 0.1 * (sumHigh+sumLow) volatilityunit = 0.04 * (sumHigh-sumLow) vcOpen = ((open-floatingaxis) / volatilityunit) vcClose =((close-floatingaxis) / volatilityunit) vcHigh = ((high-floatingaxis) / volatilityunit) vcLow = ((low-floatingaxis) / volatilityunit) if vcClose>vcOpen then DRAWCANDLE(vcOpen,vcHigh,vcLow,vcClose)coloured(10,240,10) bordercolor(0,200,0) else DRAWCANDLE(vcOpen,vcHigh,vcLow,vcClose)coloured(240,10,10) bordercolor(200,0,0) endif if vcLow<Oversold and vcClose>SlightlyOversold then DRAWARROWUP(barindex,vcLow-0.5)coloured(10,255,10) endif if vcHigh>Overbought and vcClose<SlightlyOverbought then DRAWARROWDOWN(barindex,vcHigh+0.5)coloured(255,10,10) endif endif RETURN Overbought COLOURED(250,250,250) STYLE(DOTTEDLINE,1) as "overbought area", SlightlyOverbought COLOURED(250,250,250) STYLE(DOTTEDLINE,1) as "slightly overbought area", Oversold COLOURED(250,250,250) STYLE(DOTTEDLINE,1) as "oversold area", SlightlyOversold COLOURED(250,250,250) STYLE(DOTTEDLINE,1) as "slightly oversold area" |
Example 3:
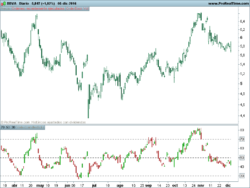
The RSI candlesticks oscillator, made of RSI returned values applied to Open/High/Low/Close.
|
1 2 3 4 5 6 7 8 9 10 |
REM RSI CHART rsiopen=RSI[14](open) rsihigh=RSI[14](high) rsilow=RSI[14](low) rsiclose=RSI[14](close) DRAWCANDLE (rsiopen,rsihigh,rsilow,rsiclose) RETURN 70 as "70", 50 as "50", 30 as "30" |
 DRAWCANDLE


Le code suivant dessine un chandelier noir avec un contour jaune alors que le corps devrait être jaune aussi.
DRAWCANDLE(y,y,p,p) coloured(204, 204, 0) bordercolor(204, 204, 0)
F.
En effet François, j’ai ce problème également. Je remonte cette information, c’est une Beta ! 🙂
Ciao Nicolas, ho provato ad aggiungere le seguenti linee:
max=highest[20](rsihigh)
min=lowest[20](rsilow)
ma alcuni massimi e alcuni minimi delle candele RSI le oltrepassano e non dovrebbero, come mai?
Poiché il rsihigh o il rsilow non sono il vero alto e basso della candela, dovresti prima cercare di sapere quale valore se l’alto reale tra rsiclose, rsiopen, rsilow e rsihigh.
Questo codice è solo una dimostrazione su come disegnare candeliere con qualsiasi valore, non un indicatore “reale”.
Hai ragione Nicolas, valori massimi e minimi possono essere anche rsiclose e rsiopen, quindi devo trovare i massimi e minimi tra i 4 prezzi:
rsiopen, rsiclose, rsihigh e rsilow.
Ma come faccio a trovare il massimo ed il minimo di 4 parametri?
La funzione “max” e “min” può trovarlo solo tra 2?
Grazie
maximum = max(rsiopen,(max(rsihigh,max(rsilow,rsiclose))))
minimum = min(rsiopen,(min(rsihigh,min(rsilow,rsiclose))))
Perfetto funziona, grazie mille Nicolas!!