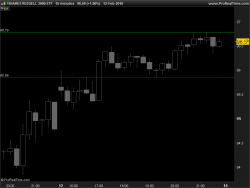
Draw an horizontal line on chart, with y coordinate.
Syntax:
|
1 |
DRAWHLINE(y1) COLOURED(R,V,B,a) |
Coloured is optional.
Example :
|
1 2 3 4 5 6 7 8 9 |
defparam drawonlastbaronly = true hh = highest[15](high) ll = lowest[15](low) DRAWHLINE(hh)coloured(0,200,0) DRAWHLINE(ll)coloured(200,0,0) RETURN |
 DRAWHLINE


Hello. Can you help me ?
I copy your code to create this indicator but he don’t accept the first line, prorealtime told me there is an error. If i try to erase the first line, he don’t accept drawhline.Thanks for your help
This is an instruction only compatible with PRT v10.3 and above.
Hello Nicolas, I am trying to colour my horizontal line by ‘my colour’ but I am getting and error for the ‘my colour’ part of the code. Is it possible to colour horizontallines and if so what do I need to do to get this to work.
TIA
Robert
Is it possible to draw a horizontal line between two dates at a certain value? Thanks in advance for any feedback.
Yes with the DRAWSEGMENT instruction (2 coordinates: start -> end of the segment).
Is it possible to erase DRAWHLINE after condition (time or other) ?
It is not possible to erase graphical objects.
Hi @Nicolas, i’d like to draw H line for example in my weekly chart based on MM (7, 20, 50). PRT v 11.1. Very easy. But how can I see them too reported in the smaller timeframes ? Daily, H4, etc… I’d like to achieve that without having to run pro order and multimeframe fonction. Just with an indicator. Thanks !
I am using DRAWHLINE in a indicator
I have no problem creating the indicator. However i would like to add thickness, and make it display gap to last price, is this possible?
You can change thickness with STYLE instruction
HOW TO DRAW A LINE BETWEEN TWO TREND LINESS
OR FROM A CANDEL BAR TOO A TREND LINE