Draw a line with extension, between 2 x,y coordinates on chart.
Syntax:
|
1 |
DRAWLINE(x1,y1,x2,y2) COLOURED(R,V,B,a) |
Coloured is optional.
Example 1:
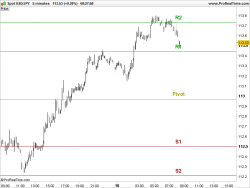
Fibonacci pivot points horizontal lines drawn with DRAWLINE instruction :
|
1 2 3 4 5 6 7 8 9 10 11 12 13 14 15 16 17 18 19 20 21 22 23 24 25 26 27 28 29 30 31 32 33 34 35 36 37 |
defparam drawonlastbaronly = true //yesterday's value dh = DHigh(1) dl = DLow(1) //fibonacci pivot points P = (dh + dl + DClose(1))/3 S1 = P - .382 * (dh-dl) S2 = P - .618 * (dh-dl) S3 = P - 1 * (dh-dl) R1 = P + .382 * (dh-dl) RR2 = P + .618 * (dh-dl) R3 = P + 1 * (dh-dl) //vertical offset to draw text correctly over horizontal lines Voffset = 5*pipsize //draw pivot points text DRAWTEXT("Pivot",barindex-2,p+Voffset,SansSerif,Bold,16)coloured(153,153,0) DRAWTEXT("R1",barindex-2,R1+Voffset,SansSerif,Bold,16)coloured(0,153,0) DRAWTEXT("R2",barindex-2,RR2+Voffset,SansSerif,Bold,16)coloured(0,153,0) DRAWTEXT("R3",barindex-2,R3+Voffset,SansSerif,Bold,16)coloured(0,153,0) DRAWTEXT("S1",barindex-2,S1+Voffset,SansSerif,Bold,16)coloured(153,0,0) DRAWTEXT("S2",barindex-2,S2+Voffset,SansSerif,Bold,16)coloured(153,0,0) DRAWTEXT("S3",barindex-2,S3+Voffset,SansSerif,Bold,16)coloured(153,0,0) //draw pivot points lines with extension DRAWLINE(barindex-1,p,barindex,p) coloured(153,153,0) DRAWLINE(barindex-1,R1,barindex,R1) coloured(0,153,0) DRAWLINE(barindex-1,RR2,barindex,RR2) coloured(0,153,0) DRAWLINE(barindex-1,R3,barindex,R3) coloured(0,153,0) DRAWLINE(barindex-1,S1,barindex,S1) coloured(153,0,0) DRAWLINE(barindex-1,S2,barindex,S2) coloured(153,0,0) DRAWLINE(barindex-1,S3,barindex,S3) coloured(153,0,0) RETURN |
Example 2:
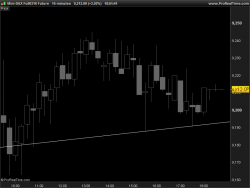
Draw a line between the 2 most recent lows from now since “period”.
|
1 2 3 4 5 6 7 8 9 10 11 12 13 14 15 16 17 18 |
defparam drawonlastbaronly = true period = 20 y2 = lowest[period](low) for i = 0 to period do if low[i]=y2 then x2 = barindex[i] elsif low[i]<y2 then y1 = low[i] x1 = barindex[i] endif next DRAWLINE(x1,y1,x2,y2) RETURN |
 DRAWLINE


Cette nouvelle instruction est ce que j’attendais.
Cependant les lignes sont affichées par dessus les résultats d’un indicateur.
S’il y avait la possibilité de choisir d’afficher les lignes en Foreground ou Background ce serait super.
My 2 cents.
F.
L’instruction “coloured” a désormais un alpha que l’on peut modifier de 0 à 255 : http://www.prorealcode.com/documentation/coloured/
Cela permet de gérer la transparence de tout objet qui possède une couleur, texte y compris.
Thumbs up ^^
Est-ce qu’on peut appliquer du style sur les lignes?
Non désolé, les lignes sont “pleines” et il n’est pas possible d’y assigner un autre style pour le moment. Mais c’est une bonne suggestion/idée !
@nicolas: I would like to draw a line segment on the last 5 bars; how would the code look like for this? it seems not to work here.
If you want to draw a SEGMENT instead of continuous line over the whole chart, please use the DRAWSEGMENT keyword instead: https://www.prorealcode.com/documentation/drawsegment/
Is it possible to define the thickness of a segment or line using the DRAWSEGMENT and DRAWLINE commands?
No sorry, line and segment are only drawn in plain line with the same thickness.
Hi, Many thanks again for this efficient tool and support. Is it somehow possible to display the value of the DRAWHLINE please ?
Yes, with DRAWTEXT, example 3 in this page: https://www.prorealcode.com/documentation/drawtext/
Hi, Is it possible to use such an infinite line as an order decision in autotrading?
It is not possible the use the line object itself, but since this line is plotted with a variable, you can simply use the same variable calculation in your ProOrder program.
Hi, is there any way to draw line without extension?
Yes with DRAWSEGMENT.
Thanks Nicolas… will try that… also, is it possible to draw in dashed line style?
yes possible to add STYLE instruction but only on v11