Draw a line segment between 2 x,y coordinates on chart.
Syntax:
|
1 |
DRAWSEGMENT(x1,y1,x2,y2) COLOURED(R,V,B,a) |
Coloured is optional.
Example 1:
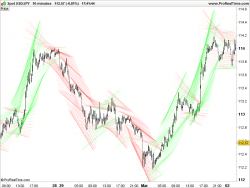
Drawing a linear regression channel with 2 colors and a dynamic alpha (transparency) gradient.
|
1 2 3 4 5 6 7 8 9 10 11 12 13 14 15 16 17 18 19 20 21 22 23 24 25 26 27 28 29 30 31 32 33 |
p=20 z1 = linearregression[p](high) z2 = linearregression[p](low) y1 = 1.5*std[p](high)+z1 y2 = 1.5*-std[p](low)+z2 if(y1>y1[p]) then Rh = 0 Gh = 255 else Rh = 255 Gh = 0 endif if(y2>y2[p]) then Rl = 0 Gl = 255 else Rl = 255 Gl = 0 endif a = (255*(y1-y2))/(300*pipsize) if a>255 then a = 255 endif DRAWSEGMENT(barindex-p*1.5,y1[p],barindex+10,y1)coloured(Rh,Gh,0,a) DRAWSEGMENT(barindex-p*1.5,y2[p],barindex+10,y2)coloured(Rl,Gl,0,a) RETURN |
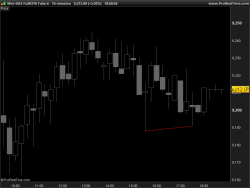
Draw a bottom line between the 2 most recent lower lows.
|
1 2 3 4 5 6 7 8 9 10 11 12 13 14 15 16 17 |
defparam drawonlastbaronly = true period = 10 y2 = lowest[period](low) for p = 0 to period do if low[p]=y2 then x2 = barindex[p] elsif low[p]<y2 then y1 = low[p] x1 = barindex[p] endif next DRAWSEGMENT(x1,y1,x2,y2)coloured(255,10,10) RETURN |
 DRAWSEGMENT

How do I draw a dotted line segment?
Not possible with DRAWSEGMENT, sorry.
Is it possible to extend lines? And give options as in the default drawings setting? Like Extend Left, Extend Right?
If you want lines to extend on left or right, use Drawline keyword instead.
Thank You! Is it possible to only extend one side? If i use drawline it becomes an infinite line.
Not possible with drawline. With DrawSegment you could try to extend on the left only with a previous far barindex in the past though.
Hello, it is possible manage the thickness with the draw segment?
yes, with STYLE added at the end of the DRAWSEGMENT line.
Is it possible to extend barindex plus n periods into the future? So the segment extends to the right?
Not possible sorry. Only known barindex are possible.
Here is the code to draw the highs
Cheers
PS: the Add PRT code does not work
_________________________________
defparam drawonlastbaronly = true
period = 10
y1 = highest[period](high)
for p = 0 to period do
if high[p]=y1 then
x1 = barindex[p]
elsif high[p]>y2 then
y2 = high[p]
x2 = barindex[p]
endif
next
DRAWSEGMENT(x1,y1,x2,y2)coloured(255,10,10)
RETURN
Extension of line to right side could be possible if x1, and x2 can take input of time on the chart or Date, DayCount i.e.
But as it stand now Prorealtime had not implement the possibility, yet not that difficult, it matter of input parament definition.
Hi, Is it possible to manage the THICKNESS of the segment please.
Something like : DRAWSEGMENT(x1,y1,x2,y2)coloured(255,0,0)thickness(2) ???
Many thanks in advance.
BR
That’s still not possible to change the thickness of any graphical objects.
I had exactly the same question, Toto. My screen is high resolution (4k) and the lines appear so thin that I have to use Windows 10’s digital magnifier to see them.
Another question: Can I change the STYLE of the line? (dotted, solid, dashed, etc.)?
It is not possible to change the line thickness and style with DRAWSEGMENT, sorry!
hi !
beginning with PRT, i’m trying to add 6 segments depending on some previous close values.
I have 6 graphics (each with a different UT : day, week, month, etc).
My segments are all displayed in the 6 graphics, but only with the first graphic values !
hat am i doing wrong ?
thanks for help …
It depends of how you have coded the segments. For a perfect understanding of your query, please open a dedicated new topic in the ProBuilder forum, and with screenshots if possible. Thank you.