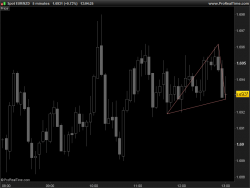
Draw a triangle on chart with 3 sets of x,y coordinates.
Syntax:
|
1 |
DRAWTRIANGLE(x1,y1,x2,y2,x3,y3) COLOURED(R,V,B,a) |
Coloured is optional.
Example :
|
1 2 3 4 5 6 7 8 9 10 11 12 13 14 15 16 17 18 19 |
defparam drawonlastbaronly = true period = 20 hh = highest[period](high) ll = lowest[period](low) for i = 1 to period if high[i] = hh then x1 = barindex[i] endif if low[i] = ll then x2 = barindex[i] endif next DRAWTRIANGLE(x1,hh,x2,ll,barindex,low)coloured(200,120,120,255) RETURN |
 DRAWTRIANGLE