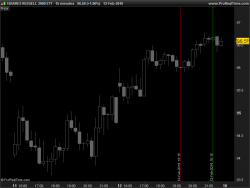
Draw a vertical line on chart with barindex coordinate.
Syntax:
|
1 |
DRAWVLINE(x1) COLOURED(R,V,B,a) |
Coloured is optional.
Example :
|
1 2 3 4 5 6 7 8 9 10 11 12 13 14 15 16 17 18 19 20 |
defparam drawonlastbaronly = true period = 15 Yhh = highest[period](high) Yll = lowest[period](low) FOR i = 0 to period do if high[i] = Yhh then Xhh = barindex[i] endif if low[i] = Yll then Xll = barindex[i] endif NEXT DRAWVLINE(Xhh)coloured(0,200,0) DRAWVLINE(Xll)coloured(200,0,0) RETURN |
 DRAWVLINE
can anyone help me code a permanent DRWAVLINE at the close of a chart candle
Sorry, but which Close?
Hi Nicolas thanks for your response, it was the close of a MA cross over, i wanted the v line to display ONLY at the close of a bar i figured how to display the line but it also displays at the MA cross over in real time which is annoying,
Then you should refer to the crossover that occurred 1 bar ago which is already confirmed.
Thanks again, that did it!
Hi,
Can anyone help me, how put the date at the beginnig of the line?
thank you
Buon pomeriggio, se volessi tracciare delle linee orizzontali sulla candela del giorno precedente (che ha generato maggiori volumi per esempio a 1h o 4h) utilizzando come riferimento il max/min dei volumi sempre della giornata precedente? Grazie
Ciò significa un sacco di codici personalizzati. Si prega di fare la tua domanda, e se possibile con la foto nel forum ProBuilder.