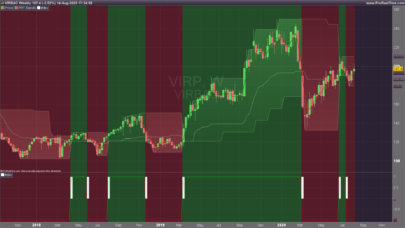
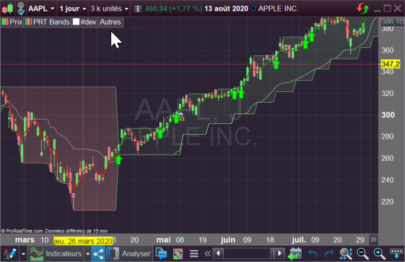
Returns the PRT Bands highest band.
Syntax:
|
1 |
PRTBANDSUP |
Example #1:
Detect the trend change (from bearish to bullish trend), channel change from red to green
|
1 2 3 4 5 6 7 8 9 10 11 12 13 14 15 16 17 18 |
up = PRTBandsUp dn = PRTBandsDown if close crosses over up and trend<=0 then //price breaks the upper band trend=1 //new bullish trend r=0 g=255 elsif close crosses under dn and trend>=0 then //price breaks the lower band trend=-1 //new bearish trend r=255 g=0 endif signal = trend<>trend[1] //trend inversion signal backgroundcolor(r,g,0,50) //color the chart background with the trend direction color return signal style(histogram) as "trend inversion", trend coloured(r,g,0) as "trend direction" |
Example #2:
Plot a up arrow below the candlestick when the Close crosses over the upper band
|
1 2 3 4 5 6 7 |
a = PRTBandsUp //Plot a up arrow below the candlestick when the Close crosses over the upper band if close crosses over a then drawarrowup(barindex,low-averagetruerange[14]/2) coloured(0,255,0) endif return |
 PRTBANDSUP

Hi, I have access to PRT via IG. IS there a way to set an alert when the short term line changes from red to green and vice versa?
Many PRT Bands screeners are already available in this french forum topic: https://www.prorealcode.com/topic/prt-bands-trend-following-prorealtime/
thanks