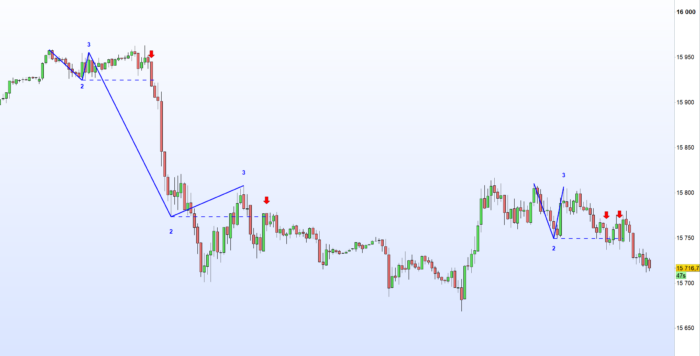
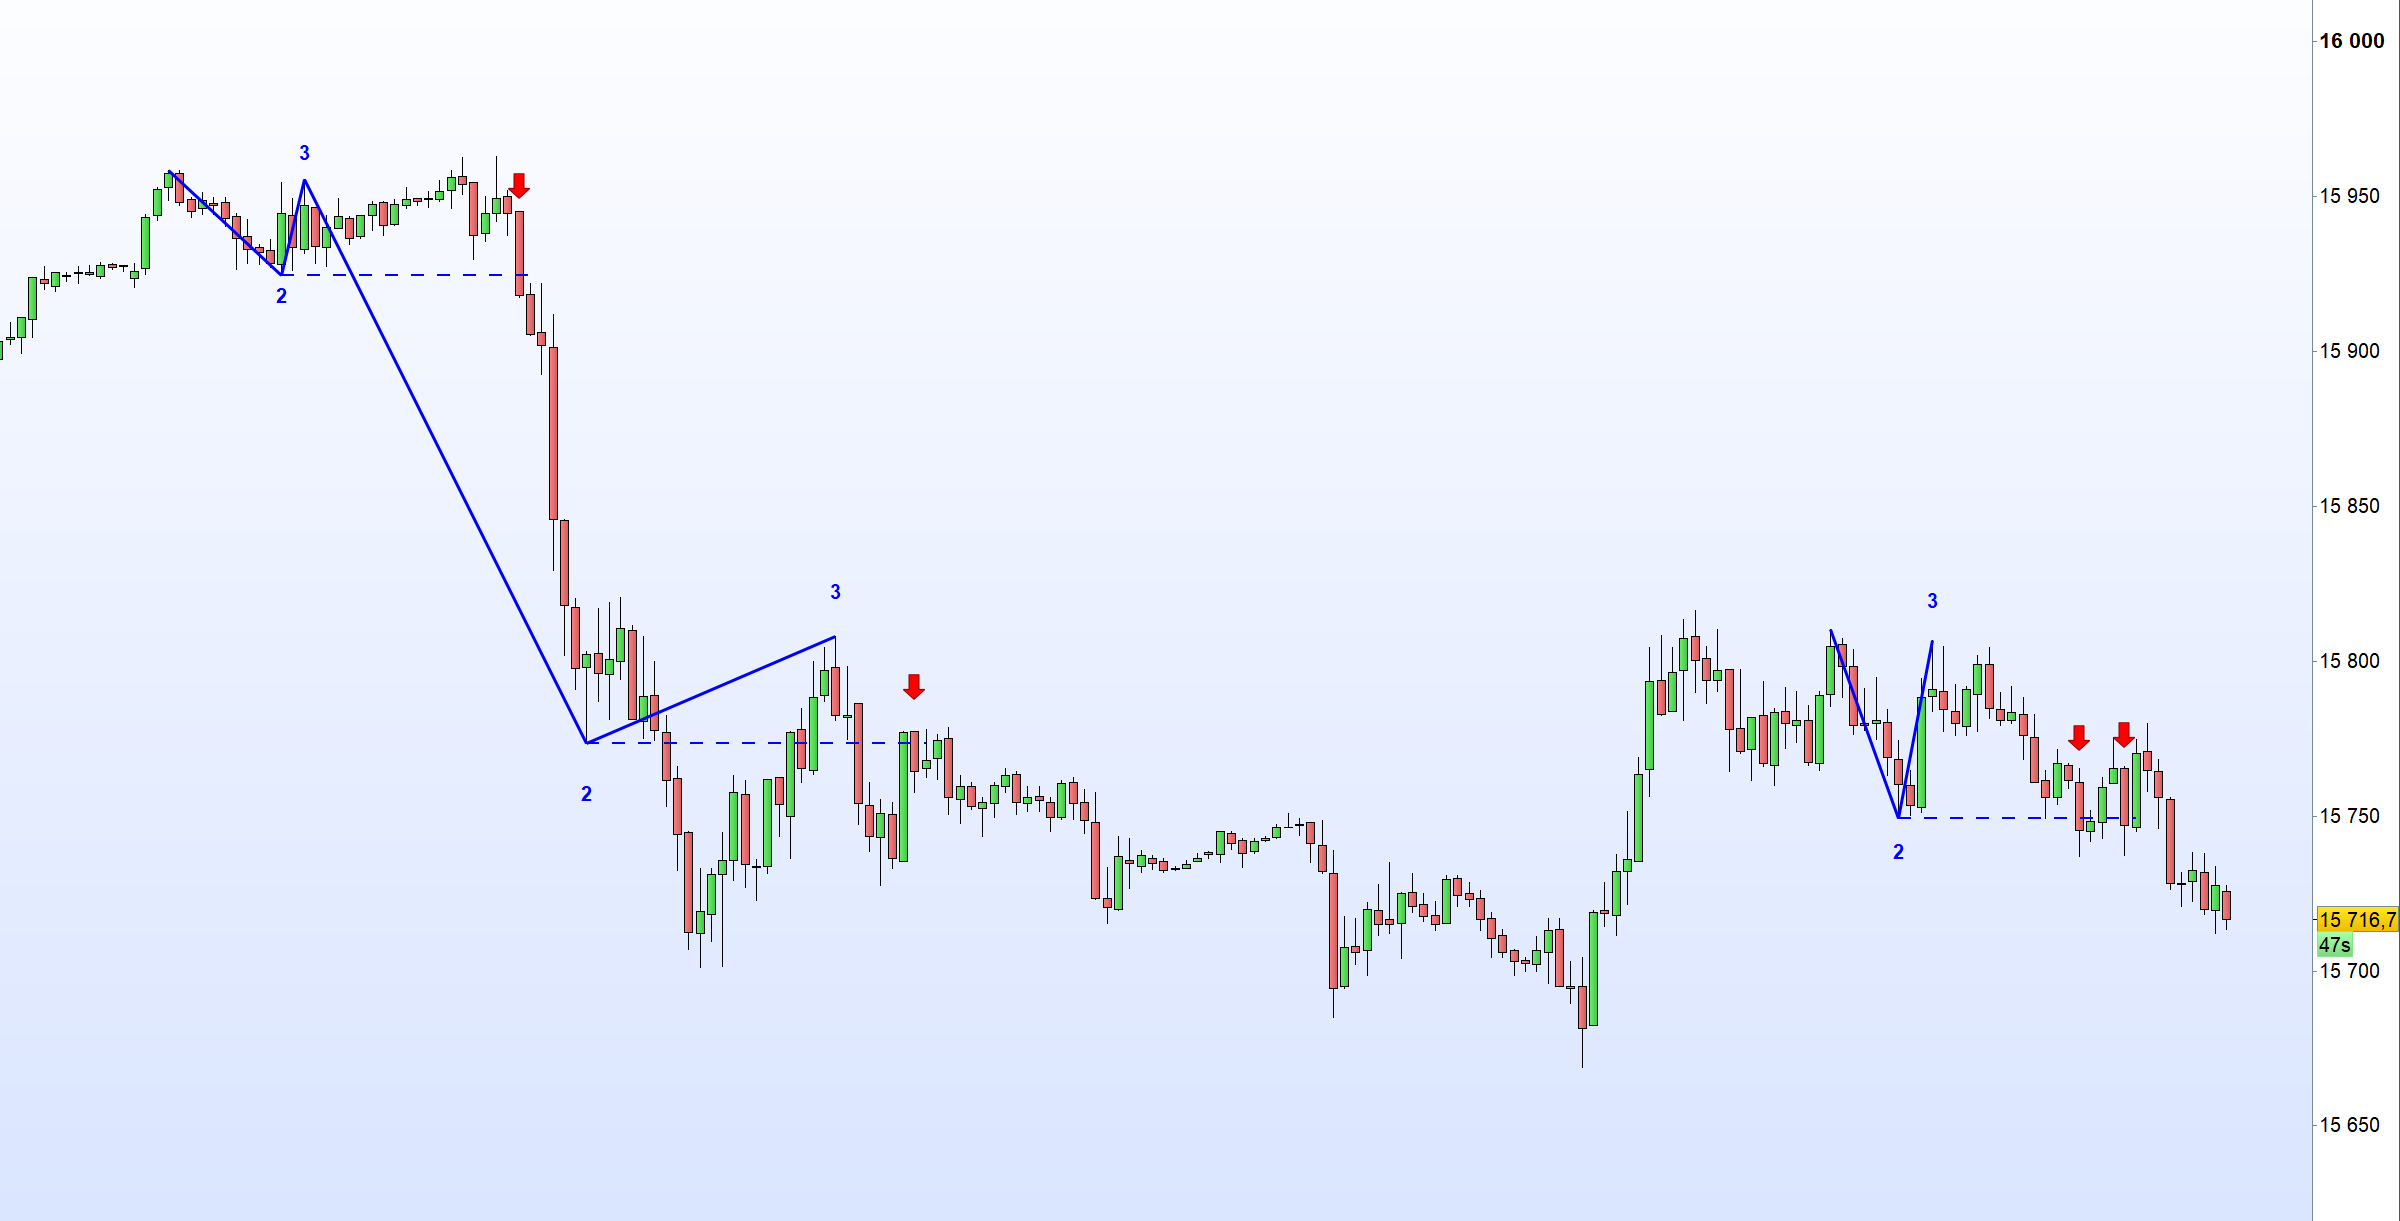
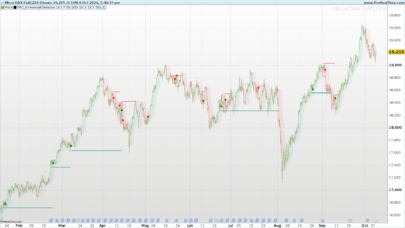
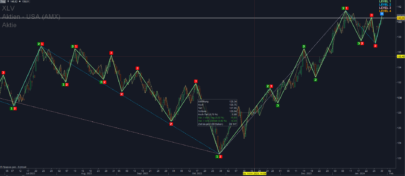
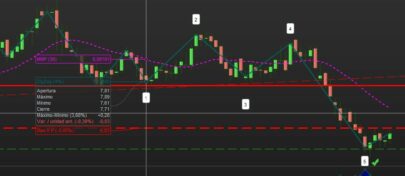
The 1-2-3 pattern is the most basic and important formation in the market. Almost every great market move has started with this formation. That is why you must use this pattern to detect the next big trend. In fact, every trader has used the 1-2-3 formation to detect a trend change without realizing it.
(original author: Zeiierman)
|
1 2 3 4 5 6 7 8 9 10 11 12 13 14 15 16 17 18 19 20 21 22 23 24 25 26 27 28 29 30 31 32 33 34 35 36 37 38 39 40 41 42 43 44 45 46 47 48 49 50 51 52 53 54 55 56 57 58 59 60 61 62 63 64 65 66 67 68 69 70 71 72 73 74 75 76 77 78 79 80 81 82 83 84 85 86 87 88 89 90 91 92 93 94 95 96 97 98 99 100 101 |
//---Initialisation once idx0 = 0 once idx1 = 0 once idx2 = 0 once pos = 0 ATR = AverageTrueRange[prd](typicalprice) IF barindex >= 2*prd+1 then If high[prd] >= highest[2*prd+1](high) and pos<=0 then If idx1 <> 0 then idx2 = idx1 Endif If idx0 <> 0 then idx1 = idx0 Endif idx0 = barindex[prd] pos=1 If idx2<>0 then If showPvts then If High[barindex-idx0]>=High[barindex-idx2] then DRAWTEXT("HH",idx0,High[barindex-idx0]+ATR/2,Dialog,Bold,20) coloured(200,0,0,255) else DRAWTEXT("LH",idx0,High[barindex-idx0]+ATR/2,Dialog,Bold,20) coloured(200,0,0,255) Endif Endif Endif Endif If Low[prd] <= Lowest[2*prd+1](low) and pos>=0 then If idx1 <> 0 then idx2 = idx1 Endif If idx0 <> 0 then idx1 = idx0 Endif idx0 = barindex[prd] pos=-1 If idx2<>0 then If showPvts then If Low[barindex-idx0]>=Low[barindex-idx2] then DRAWTEXT("HL",idx0,Low[barindex-idx0]-ATR/2,Dialog,Bold,20) coloured(0,200,0,255) else DRAWTEXT("LL",idx0,Low[barindex-idx0]-ATR/2,Dialog,Bold,20) coloured(0,200,0,255) Endif Endif Endif Endif If idx2<>0 then If pos=1 and High[barindex-idx0]>Low[barindex-idx1] and High[barindex-idx0]<High[barindex-idx2] and (Close<Low[barindex-idx1] and open>Low[barindex-idx1]) then If showPattern then DRAWTEXT("1",idx2,High[idx2]+ATR[Barindex-Idx2]/2,Dialog,Bold,20) coloured("BLUE",255) DRAWTEXT("2",idx1,Low[barindex-idx1]-ATR[Barindex-Idx1]/2,Dialog,Bold,20) coloured("BLUE",255) DRAWTEXT("3",idx0,High[barindex-idx0]+ATR[Barindex-Idx0]/2,Dialog,Bold,20) coloured("BLUE",255) DRAWSEGMENT(idx2,High[barindex-idx2],idx1,Low[barindex-idx1]) STYLE(Line,3) coloured("BLUE",255) DRAWSEGMENT(idx1,Low[barindex-idx1],idx0,High[barindex-idx0]) STYLE(Line,3) coloured("BLUE",255) Endif If showBreak then DRAWSEGMENT(idx1,Low[barindex-idx1],barindex+1,Low[barindex-idx1]) STYLE(DOTTEDLINE2,2) coloured("BLUE",255) DRAWARROWDOWN(barindex,High+ATR/2) coloured("RED",255) Endif Endif If pos=-1 and Low[barindex-idx0]<High[barindex-idx1] and Low[barindex-idx0]>Low[barindex-idx2] and (Close>High[barindex-idx1] and open<High[barindex-idx1]) then If showPattern then DRAWTEXT("1",idx2,Low[barindex-idx2]-ATR[Barindex-Idx2]/2,Dialog,Bold,20) coloured("BLUE",255) DRAWTEXT("2",idx1,High[barindex-idx1]+ATR[Barindex-Idx1]/2,Dialog,Bold,20) coloured("BLUE",255) DRAWTEXT("3",idx0,Low[barindex-idx0]-ATR[Barindex-Idx0]/2,Dialog,Bold,20) coloured("BLUE",255) DRAWSEGMENT(idx2,Low[barindex-idx2],idx1,High[barindex-idx1]) STYLE(Line,3) coloured("BLUE",255) DRAWSEGMENT(idx1,High[barindex-idx1],idx0,Low[barindex-idx0]) STYLE(Line,3) coloured("BLUE",255) Endif If showBreak then DRAWSEGMENT(idx1,High[barindex-idx1],barindex+1,High[barindex-idx1]) STYLE(DOTTEDLINE2,2) coloured("BLUE",255) DRAWARROWUP(barindex,Low-ATR/2) coloured("GREEN",255) Endif Endif Endif Endif Return |
Share this
No information on this site is investment advice or a solicitation to buy or sell any financial instrument. Past performance is not indicative of future results. Trading may expose you to risk of loss greater than your deposits and is only suitable for experienced investors who have sufficient financial means to bear such risk.
ProRealTime ITF files and other attachments :PRC is also on YouTube, subscribe to our channel for exclusive content and tutorials




Thank you for sharing this indicator. That’s a great work.
there is an error: Define the variable: prd, showBreak, showPattern, showPvts
molto interessante e grazie
ma come faccio a trasformarlo in trading system?
grazie per la risposta
Thanks for the indicator