

1-2-3 Pivots Support and Resistance Lines
This indicator draws support and resistance lines that are an extension of the last three swing highs and last three swing lows (or fractal points). It is an updated version of my indicator that can be found here:
https://www.prorealcode.com/prorealtime-indicators/last-two-pivots-support-and-resistance-lines/
Whenever a new pivot point is formed a new support or resistance line starts to be drawn that lines up with previous pivot points.
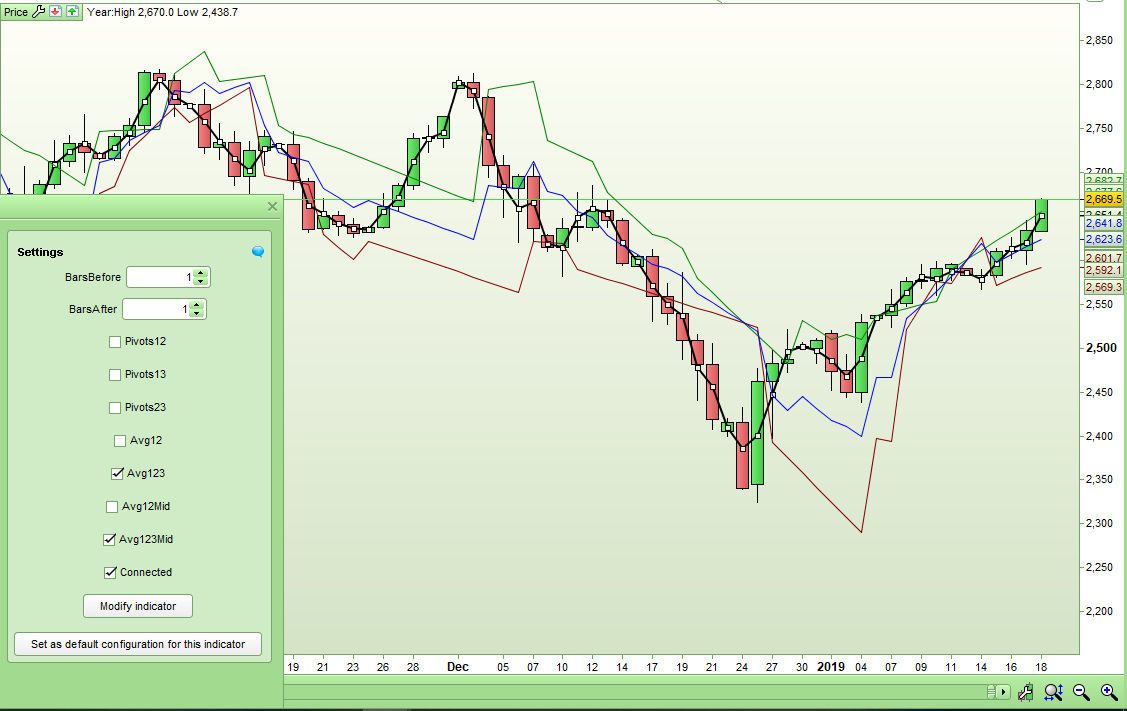
In this new version the last three swing highs and last three swing lows are used. By ticking or unticking the relevant box various support and resistance lines can be displayed or removed as follows:
- Pivots12 – Lines that are a continuation of a line connecting the last two high and low pivots.
- Pivots13 – Lines that are a continuation of a line connecting the last and the second to last high and low pivots.
- Pivots23 – Lines that are a continuation of a line connecting the second to last and third to last high and low pivots.
- Avg12 – Lines that are an average of the Pivots12 and Pivots13 lines.
- Avg123 – Lines that are an average of the Pivots12, Pivots13 and Pivots23 lines.
- Avg12Mid – A line that is mid way between the Avg12 support and resistance lines.
- Avg123Mid – A line that is mid way between the Avg123 support and resistance lines.
- Connected – All lines are drawn connected when a new pivot high or pivot low is formed
The pivot/fractals definition can be adjusted by changing the number of bars before and the number of bars after the high or low. So for example you can have a new pivot whenever a high has one candle lower either side of it or when it has two candles lower either side of it.
This indicator can be used to easily see if price is either bouncing off of support and resistance or if it is breaking out from support or resistance.
Download and import the ITF file to get full functionality.
//Last 1-2-3 Pivots Support and Resistance Lines
//By Vonasi
//18011919

//DEFPARAM CalculateOnLastBars = 1000

//BarsAfter = 1
//BarsBefore = 1
//Pivots12 = 1
//Pivots13 = 1
//Pivots23 = 1
//Avg12 = 1
//Avg123 = 1
//Avg12Mid = 1
//Avg123 = 1
//Connected = 1

BarLookBack  = BarsAfter + 1
IF low[BarsAfter] < lowest[BarsBefore](low)[BarLookBack] THEN
IF low[BarsAfter] = lowest[BarLookBack](low) THEN
Support  = low[BarsAfter]
ENDIF
ENDIF
IF high[BarsAfter] > highest[BarsBefore](high)[BarLookBack] THEN
IF high[BarsAfter] = highest[BarLookBack](high) THEN
Resistance = high[BarsAfter]
ENDIF
ENDIF

cr12 = 0
cr13 = 0
cr23 = 0
cs12 = 0
cs13 = 0
cs23 = 0
csave3 = 0
crave3 = 0
csave2 = 0
crave2 = 0
cave3mid = 0
cave2mid = 0

if pivots12 then
cr12 = 255
cs12 = 255
endif

if pivots13 then
cr13 = 255
cs13 = 255
endif

if pivots23 then
cr23 = 255
cs23 = 255
endif

if avg123 then
crave3 = 255
csave3 = 255
endif

if avg12 then
crave2 = 255
csave2 = 255
endif

if avg123mid then
cave3mid = 255
endif

if avg12mid then
cave2mid = 255
endif

if resistance <> resistance[1] then
hi3 = hi2
hi2 = hi1
hi3index = hi2index
hi2index = hi1index
hi1 = high[BarsAfter]
hi1index = BarIndex[BarsAfter]

if not connected then
cr12 = 0
cr13 = 0
cr23 = 0
crave3 = 0
crave2 = 0
cave2mid = 0
cave3mid = 0
endif
endif

if support <> support[1] then
lo3 = lo2
lo2 = lo1
lo3index = lo2index
lo2index = lo1index
lo1 = low[BarsAfter]
lo1index = BarIndex[BarsAfter]

if not connected then
cs12 = 0
cs13 = 0
cs23 = 0
csave3 = 0
csave2 = 0
cave2mid = 0
cave3mid = 0
endif
endif

//12
if hi2 > hi1 then
nexthi12 = hi1 - (((hi2 - hi1) / (hi1index - hi2index)) * (barindex - hi1index))
endif

if hi2 < hi1 then
nexthi12 = hi1 + (((hi1 - hi2) / (hi1index - hi2index)) * (barindex - hi1index))
endif

if lo2 > lo1 then
nextlo12 = lo1 - (((lo2 - lo1) / (lo1index - lo2index)) * (barindex - lo1index))
endif

if lo2 < lo1 then
nextlo12 = lo1 + (((lo1 - lo2) / (lo1index - lo2index)) * (barindex - lo1index))
endif

//13
if hi3 > hi1 then
nexthi13 = hi1 - (((hi3 - hi1) / (hi1index - hi3index)) * (barindex - hi1index))
endif

if hi3 < hi1 then
nexthi13 = hi1 + (((hi1 - hi3) / (hi1index - hi3index)) * (barindex - hi1index))
endif

if lo3 > lo1 then
nextlo13 = lo1 - (((lo3 - lo1) / (lo1index - lo3index)) * (barindex - lo1index))
endif

if lo3 < lo1 then
nextlo13 = lo1 + (((lo1 - lo3) / (lo1index - lo3index)) * (barindex - lo1index))
endif

//23
if hi3 > hi2 then
nexthi23 = hi2 - (((hi3 - hi2) / (hi2index - hi3index)) * (barindex - hi1index))
endif

if hi3 < hi2 then
nexthi23 = hi2 + (((hi2 - hi3) / (hi2index - hi3index)) * (barindex - hi1index))
endif

if lo3 > lo2 then
nextlo23 = lo2 - (((lo3 - lo2) / (lo2index - lo3index)) * (barindex - lo1index))
endif

if lo3 < lo2 then
nextlo23 = lo2 + (((lo2 - lo3) / (lo2index - lo3index)) * (barindex - lo1index))
endif

nextloave3 = (nextlo12 + nextlo13 + nextlo23)/3
nexthiave3 = (nexthi12 + nexthi13 + nexthi23)/3
nextloave2 = (nextlo12 + nextlo13)/2
nexthiave2 = (nexthi12 + nexthi13)/2
ave123mid = (nexthiave3 + nextloave3)/2
ave12mid = (nexthiave2 + nextloave2)/2

RETURN nexthi12 coloured(0,128,0,cr12) style(line,1) as "Resistance12", nextlo12 coloured (128,0,0,cs12) style(line,1) as "Support12", nexthi13 coloured(0,128,0,cr13) style(line,1) as "Resistance13", nextlo13 coloured (128,0,0,cs13) style(line,1) as "Support13", nexthi23 coloured(0,128,0,cr23) style(line,1) as "Resistance23", nextlo23 coloured (128,0,0,cs23) style(line,1) as "Support23", nexthiave3 coloured(0,128,0,crave3) style(line,1) as "Resistance Average 1-2-3", nextloave3 coloured (128,0,0,csave3) style(line,1) as "Support Average 1-2-3", nexthiave2 coloured(0,128,0,crave2) style(line,1) as "Resistance Average 1-2", nextloave2 coloured (128,0,0,csave2) style(line,1) as "Support Average 1-2", ave123mid coloured (0,0,255,cave3mid) style(line,1) as "Average Mid 1-2-3", ave12mid coloured (0,0,255,cave2mid) style(line,1) as "Average Mid 1-2"