I spotted this simple idea here:
https://blog.thinknewfound.com/2018/03/protect-participate-managing-drawdowns-with-trend-following/
and thought that I would convert it to an indicator.
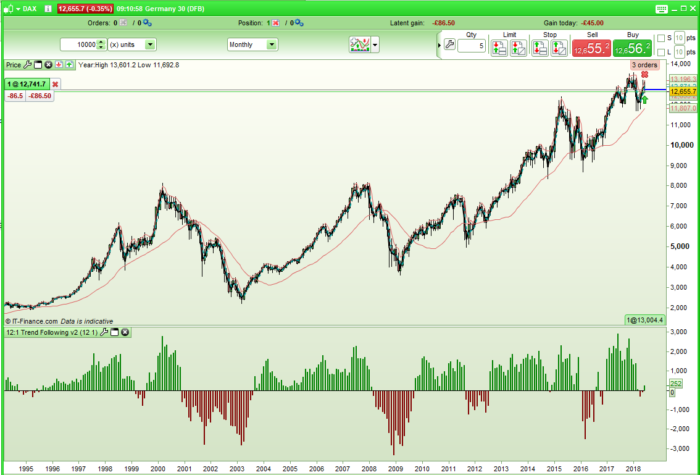
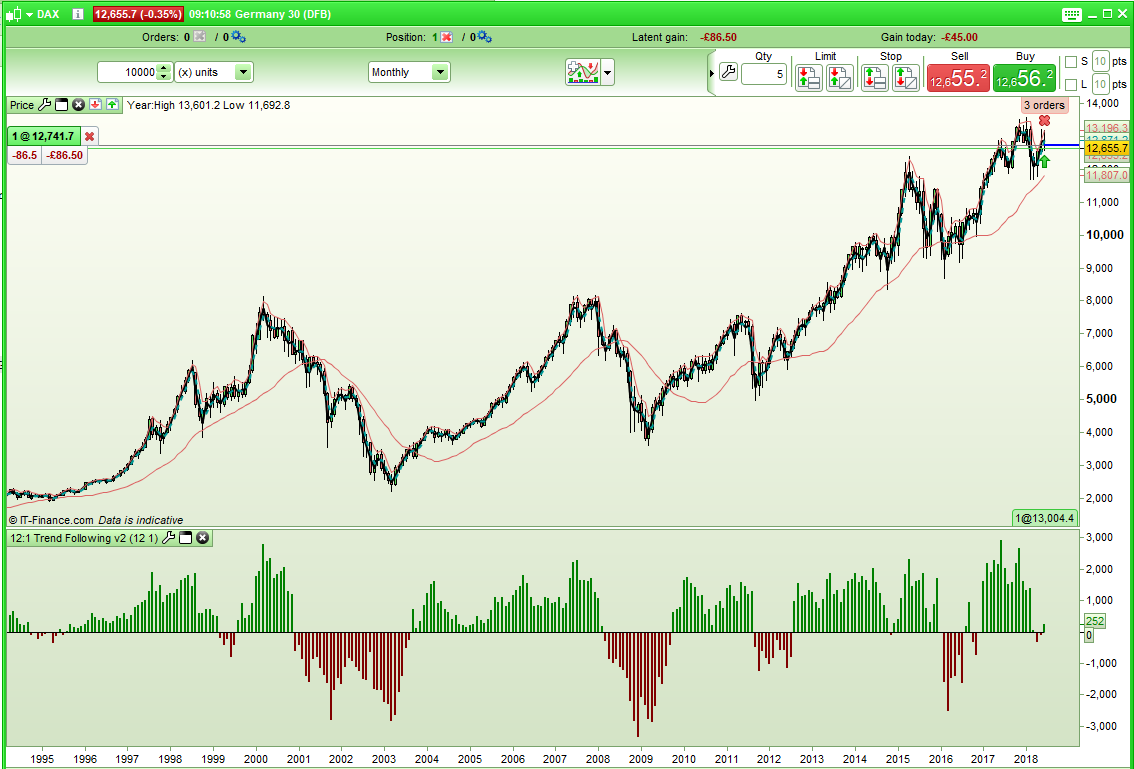
The original intention is for it to be a longer term trend indicator on monthly charts to get an idea of overall market sentiment but there is no reason why it cannot be used on shorter time frames and with different ratios.
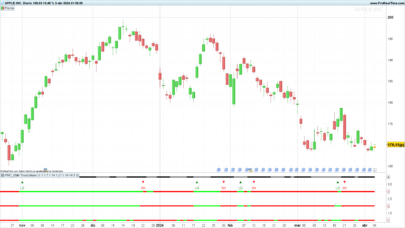
The indicator consists of taking the gain or loss over the last 12 month period and subtracting the gain or loss from the last months period. If the result is above zero then the sentiment is bullish and if below it is bearish. Obviously you would need to check this after the last months candle has closed.
You can change the ratio in the indicator by changing Period and Period2 from 12 and 1 to any other ratio such as 24:3 for example.
The output is in histogram form with the height of the histogram being the value returned from the calculation. Green is bullish and red is bearish.
Try it on other time frames and with different ratios.
ITF file attached which I recommend importing instead of cut and pasting the code.
|
1 2 3 4 5 6 7 8 9 10 11 12 13 14 15 16 17 18 |
//12:1 Indicator //By Vonasi //21 June 2018 ////Period = 12 //Period2 = 1 Filter = (close - open[Period - 1]) - (close - open[Period2 - 1]) R = 128 G = 0 IF Filter > 0 then R = 0 G = 128 endif Return Filter coloured(R,G,0) style(histogram,2) as "filter", 0 as "0" |
Share this
No information on this site is investment advice or a solicitation to buy or sell any financial instrument. Past performance is not indicative of future results. Trading may expose you to risk of loss greater than your deposits and is only suitable for experienced investors who have sufficient financial means to bear such risk.
ProRealTime ITF files and other attachments :PRC is also on YouTube, subscribe to our channel for exclusive content and tutorials







Discussion on this indicator/filter can be found here: https://www.prorealcode.com/topic/121-trend-following/