
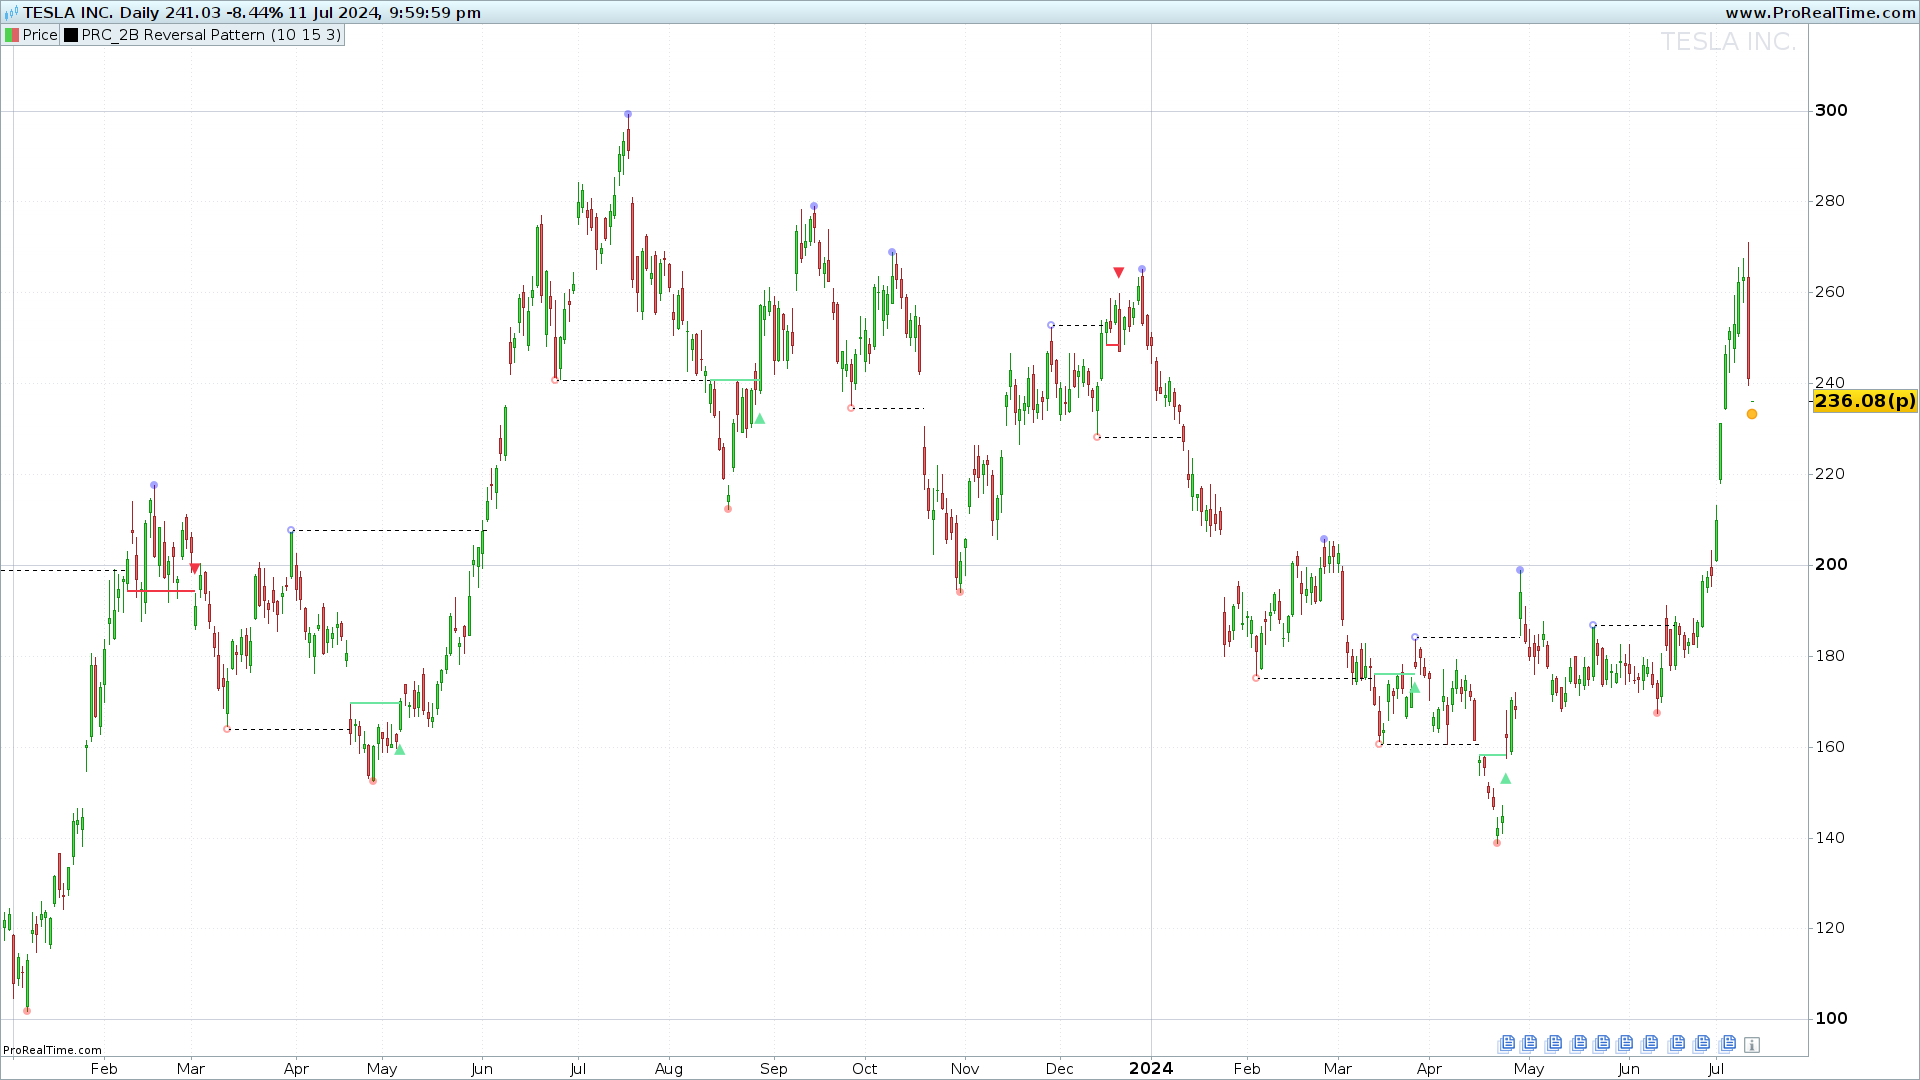
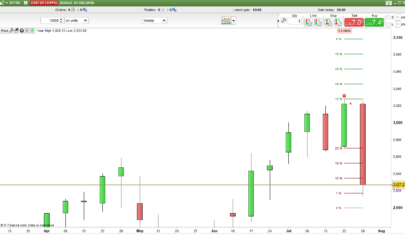
The “2B Reversal Pattern” indicator, developed by Zeiierman, is a powerful tool for detecting reversal patterns in the market. This indicator is based on the 2B reversal theory, popularized by trader Victor Sperandeo.
The 2B Reversal Pattern is useful for identifying potential trend changes and can be applied across various timeframes to improve the accuracy of trading entries and exits.
Description of the 2B Reversal Pattern Indicator
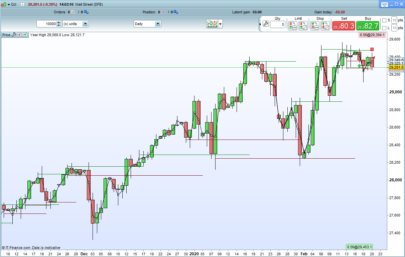
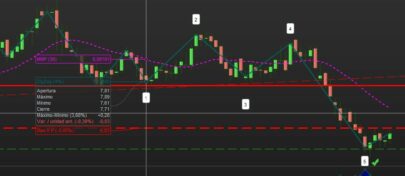
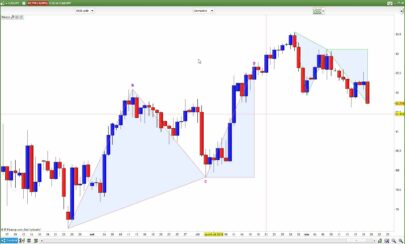
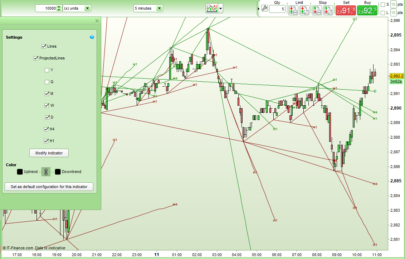
The 2B Reversal Pattern relies on identifying false breakouts at support or resistance levels.
The logic behind this pattern is that when the price attempts to break a significant level but fails to maintain it, a reversal is likely to occur. This indicator automates the detection of these patterns, providing clear visual signals on the chart.
Pivot Point Calculation
To calculate pivot points, the indicator analyzes a defined range of bars (prd parameter). It identifies high (ph) and low (pl) pivots based on specific conditions:
- Low Pivots: Identified when the lowest price (
src1) is lower than in the previous and following bars within the defined range. - High Pivots: Identified when the highest price (
src2) is higher than in the previous and following bars within the defined range.
|
1 2 3 4 5 6 7 8 9 10 11 |
if src1 > src1[prd] and lowest[prd](src1) > src1[prd] and src1[prd] < lowest[prd](src1)[prd+1] then pl = low[prd] plL = barindex[prd] drawpoint(barindex[prd],low[prd],2)coloured("red",90) endif if src2 < src2[prd] and highest[prd](src2) < src2[prd] and src2[prd] > highest[prd](src2)[prd+1] then ph = high[prd] phL = barindex[prd] drawpoint(barindex[prd],high[prd],2)coloured("blue",90) endif |
Pattern Detection
The indicator not only identifies pivots but also detects and confirms false breakouts:
- Down Breakout: Confirmed when the close crosses below the high pivot (
ph). - Up Breakout: Confirmed when the close crosses above the low pivot (
pl).
Additionally, the indicator uses the average true range (atr) to add segments and text to the chart, providing a clear visual signal of the reversal.
|
1 2 3 4 5 6 7 8 9 10 11 |
if close crosses under bomin and barindex - bominL <= maxi and barindex - bominL >= mini then drawsegment(bominL, bomin, barindex, bomin) coloured(242, 54, 69) style(line, 2) drawtext("▼", barindex, high + atr * 0.5) coloured(242, 54, 69) bomin = 0 endif if close crosses over bomax and barindex - bomaxL <= maxi and barindex - bomaxL >= mini then drawsegment(bomaxL, bomax, barindex, bomax) coloured(108, 229, 160) style(line, 2) drawtext("▲", barindex, low - atr * 0.5) coloured(108, 229, 160) bomax = 0 endif |
Indicator Configuration
The 2B Reversal Pattern indicator comes with default parameters that can be adjusted to fit different trading strategies:
prd: Period for pivot calculation (default: 20).maxi: Maximum number of bars to confirm the breakout (default: 15).mini: Minimum number of bars to confirm the breakout (default: 3).
These parameters allow traders to customize the indicator’s sensitivity according to their needs.
Conclusion
The “2B Reversal Pattern” indicator is a valuable tool for any trader looking to detect and capitalize on reversal patterns in the market. Its ability to identify false breakouts and provide clear visual signals makes it ideal for improving accuracy in trading decisions. By adjusting its parameters, traders can tailor this indicator to their specific strategies and preferred timeframes.
|
1 2 3 4 5 6 7 8 9 10 11 12 13 14 15 16 17 18 19 20 21 22 23 24 25 26 27 28 29 30 31 32 33 34 35 36 37 38 39 40 41 42 43 44 45 46 47 48 49 50 51 52 53 54 55 56 57 58 59 60 61 62 63 64 65 66 |
//-------------------------------------------------------------------// //PRC_2B Reversarl Pattern //version = 0 //27.06.2024 //Iván González @ www.prorealcode.com //Sharing ProRealTime knowledge //-------------------------------------------------------------------// //-----Inputs--------------------------------------------------------// prd=20 maxi=10 mini=3 src1 = low src2 = high //-------------------------------------------------------------------// //-----Pivot Point Calculation---------------------------------------// //-----pivots low if src1 > src1[prd] and lowest[prd](src1) > src1[prd] and src1[prd] < lowest[prd](src1)[prd+1] then pl=low[prd] plL=barindex[prd] drawpoint(barindex[prd],low[prd],2)coloured("red",90) endif //-----pivots high if src2 < src2[prd] and highest[prd](src2)<src2[prd] and src2[prd]>highest[prd](src2)[prd+1] then ph=high[prd] phL=barindex[prd] drawpoint(barindex[prd],high[prd],2)coloured("blue",90) endif //-------------------------------------------------------------------// //-----Pattern Detection---------------------------------------------// //-----Calculate price level to check breakout down if close crosses over ph then bomin=low bominL=barindex drawsegment(phL,ph,bominL,ph)style(dottedline) drawpoint(phL,ph,1)coloured("white") ph=undefined endif //-----Calculate price level to check breakout up if close crosses under pl then bomax=high bomaxL=barindex drawsegment(plL,pl,bomaxL,pl)style(dottedline) drawpoint(plL,pl,1)coloured("white") pl=undefined endif //-----Breakout down confirmation atr=averagetruerange[14](close) if close crosses under bomin and barindex-bominL<=maxi and barindex-bominL>=mini then drawsegment(bominL,bomin,barindex,bomin)coloured(242,54,69)style(line,2) drawtext("▼",barindex,high+atr*0.5)coloured(242,54,69) bomin=0 endif //-----Breakout up confirmation if close crosses over bomax and barindex-bomaxL<=maxi and barindex-bomaxL>=mini then drawsegment(bomaxL,bomax,barindex,bomax)coloured(108,229,160)style(line,2) drawtext("▲",barindex,low-atr*0.5)coloured(108,229,160) bomax=0 endif //-----Restart price level y cross is to late/soon if close crosses over bomax then bomax=0 elsif close crosses under bomin then bomin=0 endif //-------------------------------------------------------------------// return |
Share this
No information on this site is investment advice or a solicitation to buy or sell any financial instrument. Past performance is not indicative of future results. Trading may expose you to risk of loss greater than your deposits and is only suitable for experienced investors who have sufficient financial means to bear such risk.
ProRealTime ITF files and other attachments :
Find other exclusive trading pro-tools on ![]()
PRC is also on YouTube, subscribe to our channel for exclusive content and tutorials


Ciao Ivan, avevo bisogno di chiarimenti sul funzionamento del tuo indicatore: cosa segnala quando, ad esempio da un massimo precedente, viene disegnato un segmento tratteggiato? e cosa indica quando disegna i pallini sui massimi o sui minimi? forse che sono nuovi massimi e nuovi minimi relativi in quel momento? intanto grazie e soprattutto grazie per l’indicatore