

3D Candlesticks (CCI,RSI,Stochastic,Cycle,DI)
July 6, 2018, 7:26 AM
Indicators
10 Comments
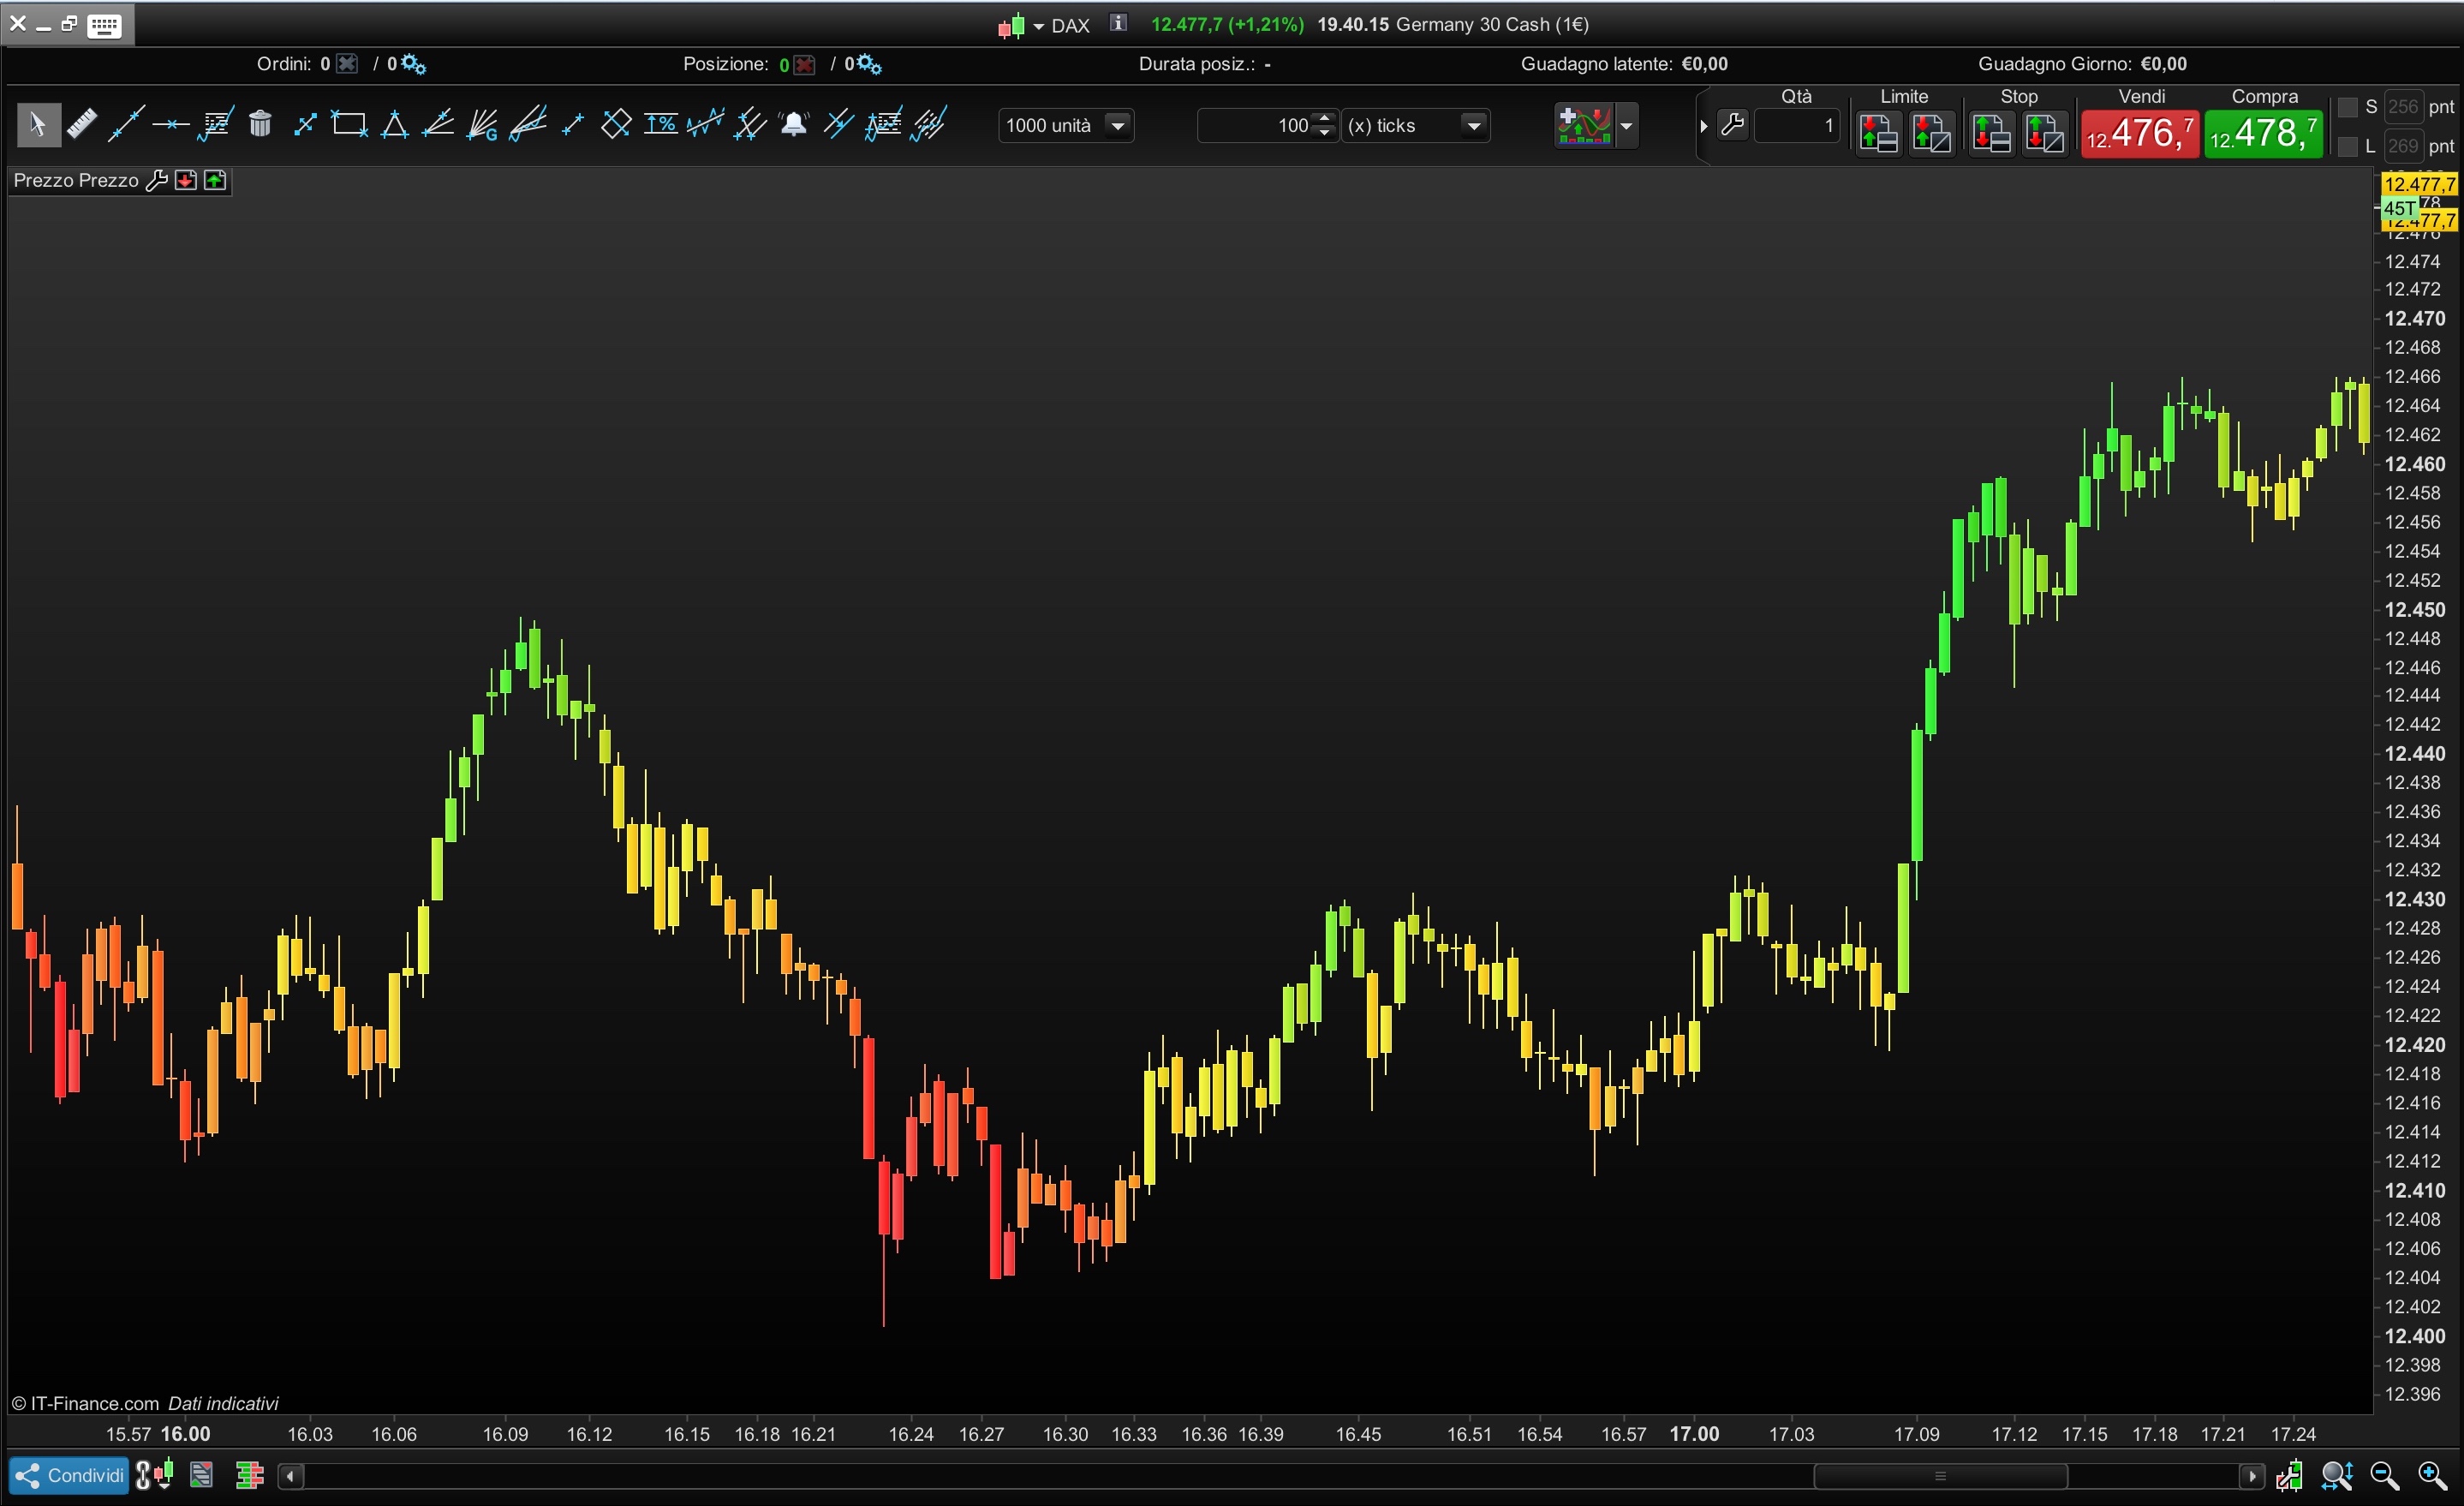
This simple indicator, allows to interpret the values of the oscillator selected through the colors on the candlesticks and directly on the price chart.
I have proposed the classical oscillators with canonical colors.
You can also translate the 3d candle under the original to maintain both.
You can choose the following oscillators:
- COMMODITY CHANNEL INDEX
- RSI
- STOCHASTIC
- CYCLE
- DIRECTIONAL INDEX
Settings are modified at the top of the code or directly into the indicator’s settings window if you choose to download and importe the file below.
//05.07.2018
//ALE@PROREALCODE
//https://www.automatictrading.it/
////////////////////////////////////////////////////////////
TranslateCandle            =1       //  To maintain both the candles on the graph without overlap
TransRange                 =0.01    //  To choose distance of the 3D caNdle
Transparency               =4
////////////////////////////////////////////////////////////
ONCE CandleCci             =1       // CANDLE + COMMODITY CHANNEL INDEX COLOUR
ONCE CandleRsi             =0       // CANDLE + RSI COLOUR
ONCE CandleStochastic      =0       // CANDLE + STOCASTIC COLOUR
ONCE CandleCycle           =0       // CANDLE + CYCLE COLOUR
ONCE CandleDI              =0       // CANDLE + DIRECTIONAL INDEX COLOUR

//////////////////////////////V//////////////////////////////
ONCE CciPeriod             =20
ONCE RsiPeriod             =14
ONCE N                     =14
ONCE K                     =3
ONCE DiPeriod              =14

//////////////////////////////V//////////////////////////////

If CandleCci then                                 // CANDLE + COMMODITY CHANNEL INDEX COLOUR
 MyCci  = Cci[max(1,CciPeriod)](customclose)
 R = (200-MyCci)
 G =(200+MyCci)
 if TranslateCandle then
  DRAWCANDLE(open-(open*TransRange*pointsize), high-(high*TransRange*pointsize), low-(low*TransRange*pointsize), close-(close*TransRange*pointsize)) Coloured (R,G,0,transparency*50)
 else
  DRAWCANDLE(open, high, low, close) Coloured (R,G,0,transparency*50)
 endif
Elsif CandleRsi then                           // CANDLE + RSI COLOUR
 MyRsi    = RSI[max(1,RsiPeriod)](customclose)
 R =50+(200-(MyRsi-50)*12)
 G =50+(200+(MyRsi-50)*12)
 if TranslateCandle then
  DRAWCANDLE(open-(open*TransRange*pointsize), high-(high*TransRange*pointsize), low-(low*TransRange*pointsize), close-(close*TransRange*pointsize)) Coloured (R,G,0,transparency*50)
 else
  DRAWCANDLE(open, high, low, close) Coloured (R,G,0,transparency*50)
 endif
Elsif CandleStochastic then                           // CANDLE + STOCHASTIC COLOUR
 MyStoch    = Stochastic[max(1,N),max(1,K)](customclose)
 R =50+(200-(MyStoch-50)*6)
 G =50+(200+(MyStoch-50)*6)
 if TranslateCandle then
  DRAWCANDLE(open-(open*TransRange*pointsize), high-(high*TransRange*pointsize), low-(low*TransRange*pointsize), close-(close*TransRange*pointsize)) Coloured (R,G,0,transparency*50)
 else
 DRAWCANDLE(open, high, low, close) Coloured (R,G,0,transparency*50)
 endif
Elsif CandleCycle then                           // CANDLE + CYCLE COLOUR
 MyCycle    = Cycle(customclose)
 R = (200-MyCycle*10)
 G =(200+MyCycle*10)
 if TranslateCandle then
  DRAWCANDLE(open-(open*TransRange*pointsize), high-(high*TransRange*pointsize), low-(low*TransRange*pointsize), close-(close*TransRange*pointsize)) Coloured (R,G,0,transparency*50)
 else
  DRAWCANDLE(open, high, low, close) Coloured (R,G,0,transparency*50)
 endif
Elsif CandleDI then                              // CANDLE + DIRECTIONAL INDEX
 MyDi = DI[max(1,DiPeriod)](customclose)
 R = 50+(200-MyDi*10)
 G =50+(200+MyDi*10)
 if TranslateCandle then
  DRAWCANDLE(open-(open*TransRange*pointsize), high-(high*TransRange*pointsize), low-(low*TransRange*pointsize), close-(close*TransRange*pointsize)) Coloured (R,G,0,(transparency)*50)
 else
  DRAWCANDLE(open, high, low, close)Coloured (R,G,0,transparency*50)
 endif

endif

Return
Download
Filename:
3D_CANDLE.itf
Downloads:
574
Master
My name is Alessandro, i'm a trader since 2006
You can find me on my website: <a href="http://www.automatictrading.it/" rel="dofollow">www.automatictrading.it</a>
<strong>(trading programming services Italy)</strong>
Italy
Author’s Profile
Loading...