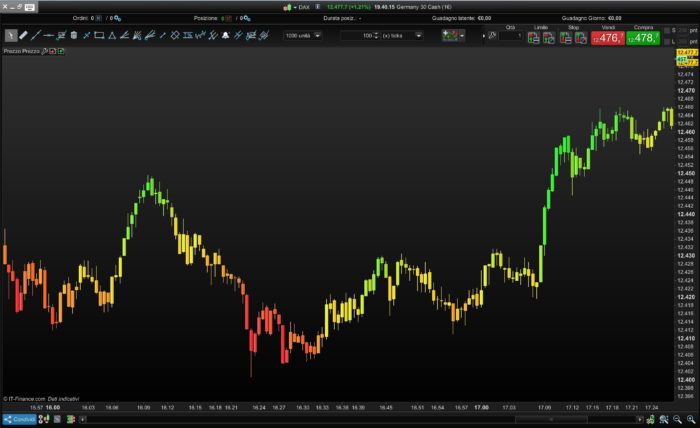
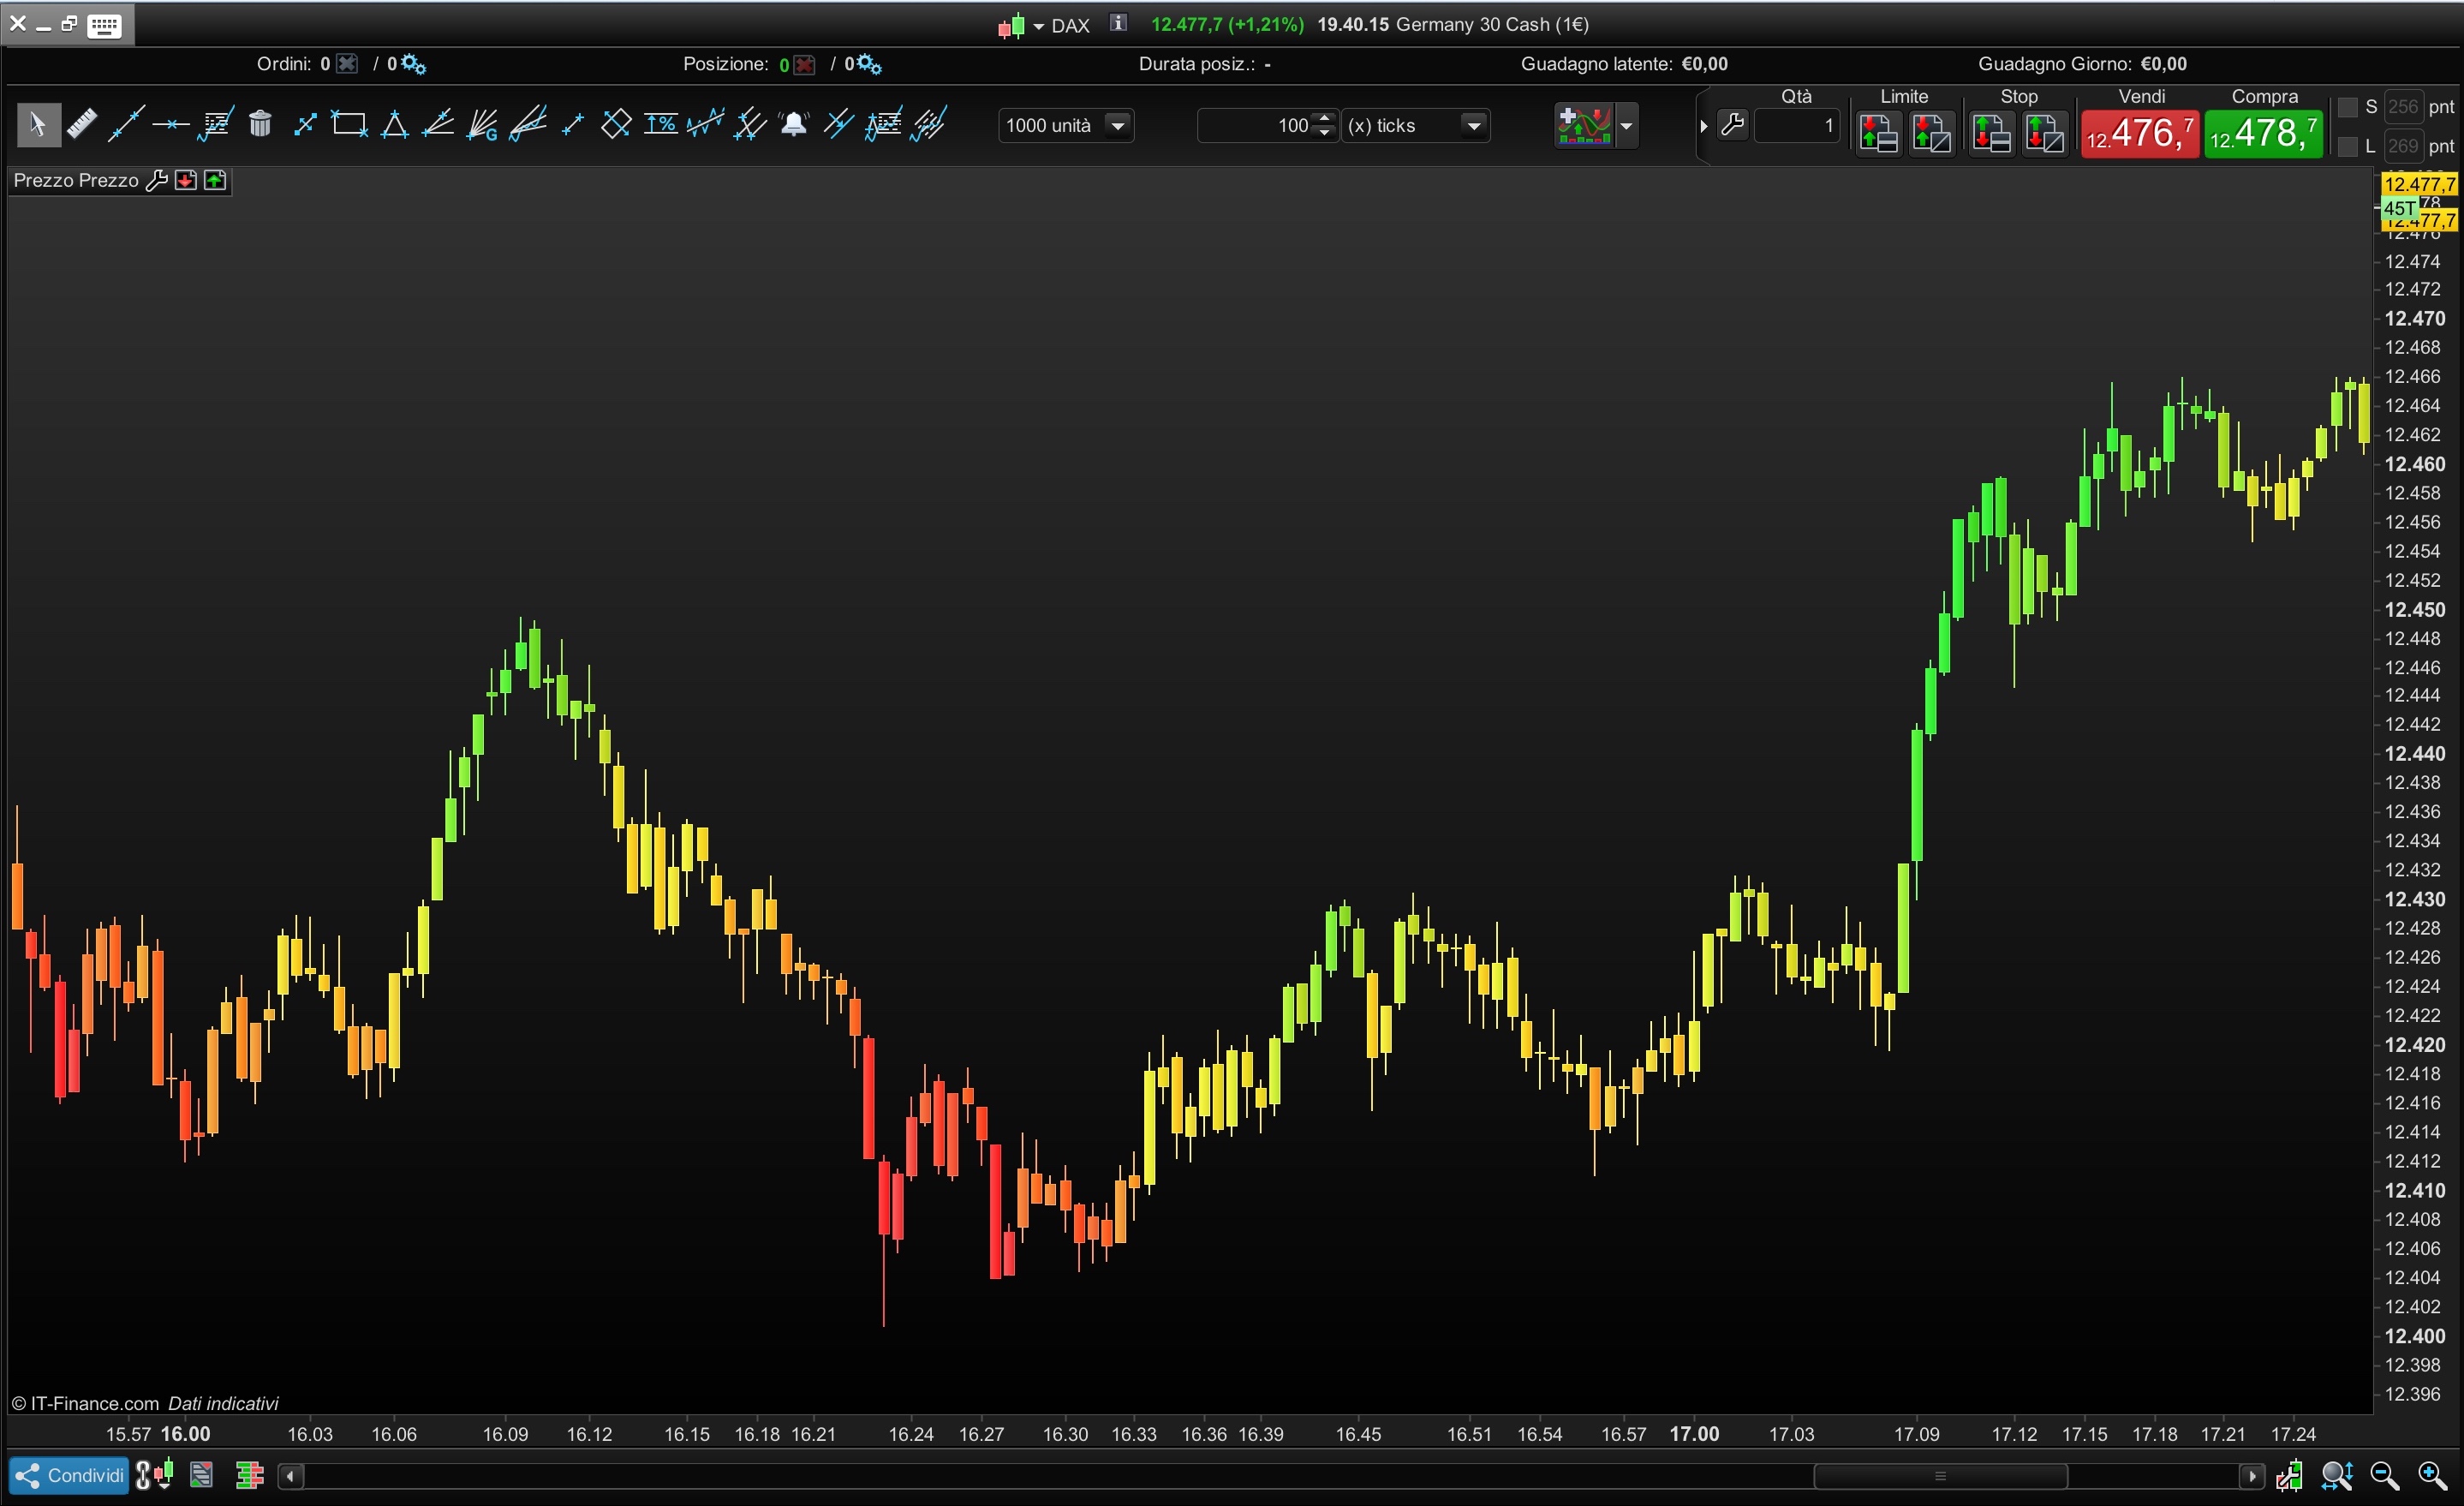
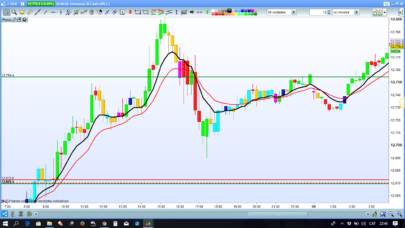
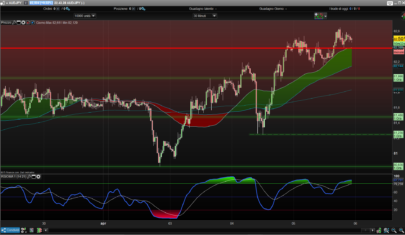
This simple indicator, allows to interpret the values of the oscillator selected through the colors on the candlesticks and directly on the price chart.
I have proposed the classical oscillators with canonical colors.
You can also translate the 3d candle under the original to maintain both.
You can choose the following oscillators:
- COMMODITY CHANNEL INDEX
- RSI
- STOCHASTIC
- CYCLE
- DIRECTIONAL INDEX
Settings are modified at the top of the code or directly into the indicator’s settings window if you choose to download and importe the file below.
|
1 2 3 4 5 6 7 8 9 10 11 12 13 14 15 16 17 18 19 20 21 22 23 24 25 26 27 28 29 30 31 32 33 34 35 36 37 38 39 40 41 42 43 44 45 46 47 48 49 50 51 52 53 54 55 56 57 58 59 60 61 62 63 64 65 66 67 68 69 70 71 72 |
//05.07.2018 //ALE@PROREALCODE //https://www.automatictrading.it/ //////////////////////////////////////////////////////////// TranslateCandle =1 // To maintain both the candles on the graph without overlap TransRange =0.01 // To choose distance of the 3D caNdle Transparency =4 //////////////////////////////////////////////////////////// ONCE CandleCci =1 // CANDLE + COMMODITY CHANNEL INDEX COLOUR ONCE CandleRsi =0 // CANDLE + RSI COLOUR ONCE CandleStochastic =0 // CANDLE + STOCASTIC COLOUR ONCE CandleCycle =0 // CANDLE + CYCLE COLOUR ONCE CandleDI =0 // CANDLE + DIRECTIONAL INDEX COLOUR //////////////////////////////V////////////////////////////// ONCE CciPeriod =20 ONCE RsiPeriod =14 ONCE N =14 ONCE K =3 ONCE DiPeriod =14 //////////////////////////////V////////////////////////////// If CandleCci then // CANDLE + COMMODITY CHANNEL INDEX COLOUR MyCci = Cci[max(1,CciPeriod)](customclose) R = (200-MyCci) G =(200+MyCci) if TranslateCandle then DRAWCANDLE(open-(open*TransRange*pointsize), high-(high*TransRange*pointsize), low-(low*TransRange*pointsize), close-(close*TransRange*pointsize)) Coloured (R,G,0,transparency*50) else DRAWCANDLE(open, high, low, close) Coloured (R,G,0,transparency*50) endif Elsif CandleRsi then // CANDLE + RSI COLOUR MyRsi = RSI[max(1,RsiPeriod)](customclose) R =50+(200-(MyRsi-50)*12) G =50+(200+(MyRsi-50)*12) if TranslateCandle then DRAWCANDLE(open-(open*TransRange*pointsize), high-(high*TransRange*pointsize), low-(low*TransRange*pointsize), close-(close*TransRange*pointsize)) Coloured (R,G,0,transparency*50) else DRAWCANDLE(open, high, low, close) Coloured (R,G,0,transparency*50) endif Elsif CandleStochastic then // CANDLE + STOCHASTIC COLOUR MyStoch = Stochastic[max(1,N),max(1,K)](customclose) R =50+(200-(MyStoch-50)*6) G =50+(200+(MyStoch-50)*6) if TranslateCandle then DRAWCANDLE(open-(open*TransRange*pointsize), high-(high*TransRange*pointsize), low-(low*TransRange*pointsize), close-(close*TransRange*pointsize)) Coloured (R,G,0,transparency*50) else DRAWCANDLE(open, high, low, close) Coloured (R,G,0,transparency*50) endif Elsif CandleCycle then // CANDLE + CYCLE COLOUR MyCycle = Cycle(customclose) R = (200-MyCycle*10) G =(200+MyCycle*10) if TranslateCandle then DRAWCANDLE(open-(open*TransRange*pointsize), high-(high*TransRange*pointsize), low-(low*TransRange*pointsize), close-(close*TransRange*pointsize)) Coloured (R,G,0,transparency*50) else DRAWCANDLE(open, high, low, close) Coloured (R,G,0,transparency*50) endif Elsif CandleDI then // CANDLE + DIRECTIONAL INDEX MyDi = DI[max(1,DiPeriod)](customclose) R = 50+(200-MyDi*10) G =50+(200+MyDi*10) if TranslateCandle then DRAWCANDLE(open-(open*TransRange*pointsize), high-(high*TransRange*pointsize), low-(low*TransRange*pointsize), close-(close*TransRange*pointsize)) Coloured (R,G,0,(transparency)*50) else DRAWCANDLE(open, high, low, close)Coloured (R,G,0,transparency*50) endif endif Return |
Share this
No information on this site is investment advice or a solicitation to buy or sell any financial instrument. Past performance is not indicative of future results. Trading may expose you to risk of loss greater than your deposits and is only suitable for experienced investors who have sufficient financial means to bear such risk.
ProRealTime ITF files and other attachments :PRC is also on YouTube, subscribe to our channel for exclusive content and tutorials



Buongiorno, come usarlo per entrare in posizione?
It is not possible to answer to your question. This indicator is simple, but the oscillators that it describes are very complex. This oscillators allow you to create many strategies.
This indicator allows you to look at the chart differently and stimulate your ingenius
Ok, grazie ale
🙂
Hola Ale
Can we have this same code from Nicolas’s code in smoothed heikin Ashi?
Sorry the function Add PRT code does not work!
HEIKIN ASHI SMOOTHED PRC 22.10.2016
// SmoothPeriod=2
xClose = (open+high+low+close)/4
IF BarIndex=0 THEN
xOpen = open
xHigh = high
xLow = low
ELSE
xOpen = (xOpen[1] + xClose[1])/2
xHigh = Max(Max(high, xOpen), xClose)
xLow = Min(Min(low, xOpen), xClose)
ENDIF
AvOpen=Average[SmoothPeriod](xOpen)
AvHigh=Average[SmoothPeriod](xHigh)
AvLow=Average[SmoothPeriod](xLow)
Avclose=Average[SmoothPeriod](xClose)
DRAWCANDLE(AvOpen, AvHigh, AvLow, AvClose)
Return
Ok, We can discuss in the topic “3D Candlesticks TOPIC”
Write me more details
Is there a way to make entry alert in the dark green bar long and in the dark red bar short?
Hi
the color is given by a numerical value derived from the oscillator in use.
If you compare the color of the candle with the value of the oscillator you will be able to set your preferred conditions using the platform oscillator directly.
Thanks mate
Hello, it is possible to have this indicator but instead of colors rather have numbers ranging from -100 to 0 and from 0 to +100 above the candles? (on the graph) Thank you.