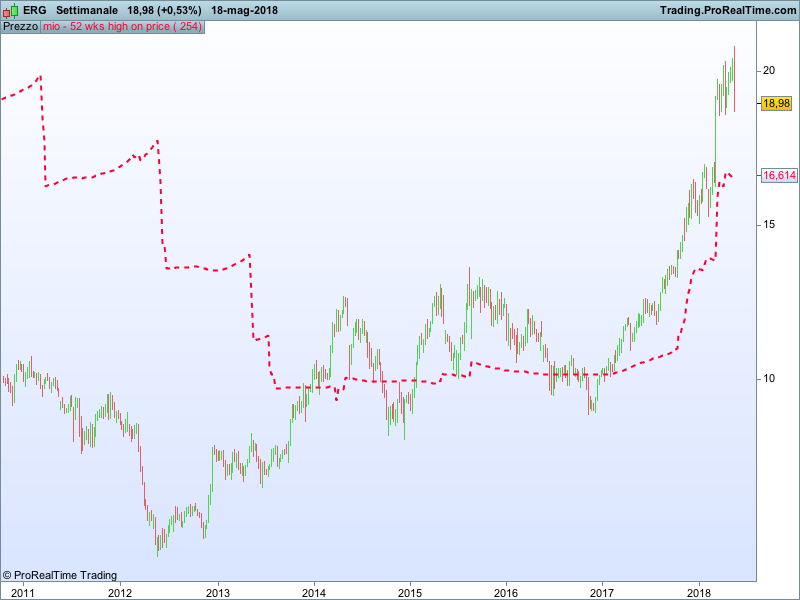
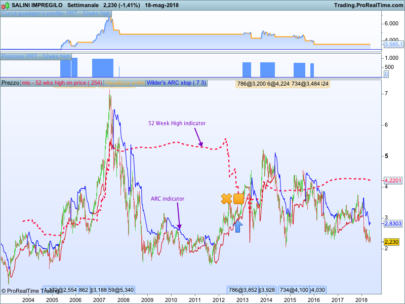
One of the most efficient strategies in fundamental analysis is entering the market when a stock is close to the 52 weeks high. This strat has been proofed to be successful throughout the decades with good earnings. This indicator will graphically tell you when you are entering the buffer for successfully applying such a strategy.
You can overlay this indicator on the price window. When the price crosses above the 52-week-high line it’s time to add the stock to your portfolio and when crosses under time to dump it.
Blue skies!!
|
1 2 3 4 5 |
a=highest[period](high[1]) cutbasso=(a-1.5*std[254](close)) return cutbasso style (dottedline) |
Share this
No information on this site is investment advice or a solicitation to buy or sell any financial instrument. Past performance is not indicative of future results. Trading may expose you to risk of loss greater than your deposits and is only suitable for experienced investors who have sufficient financial means to bear such risk.
ProRealTime ITF files and other attachments :PRC is also on YouTube, subscribe to our channel for exclusive content and tutorials


