ABCD Pattern indicator
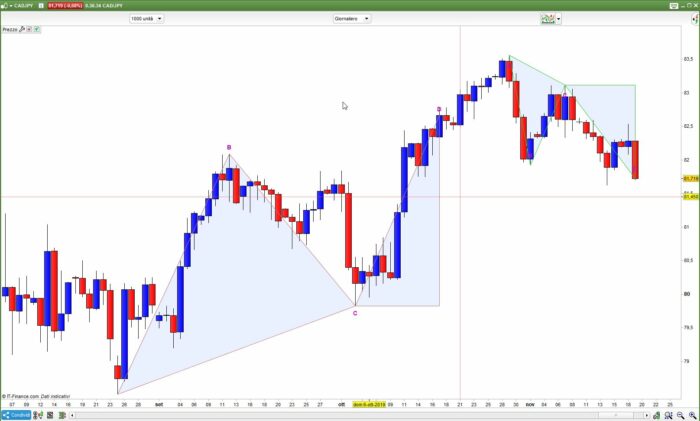
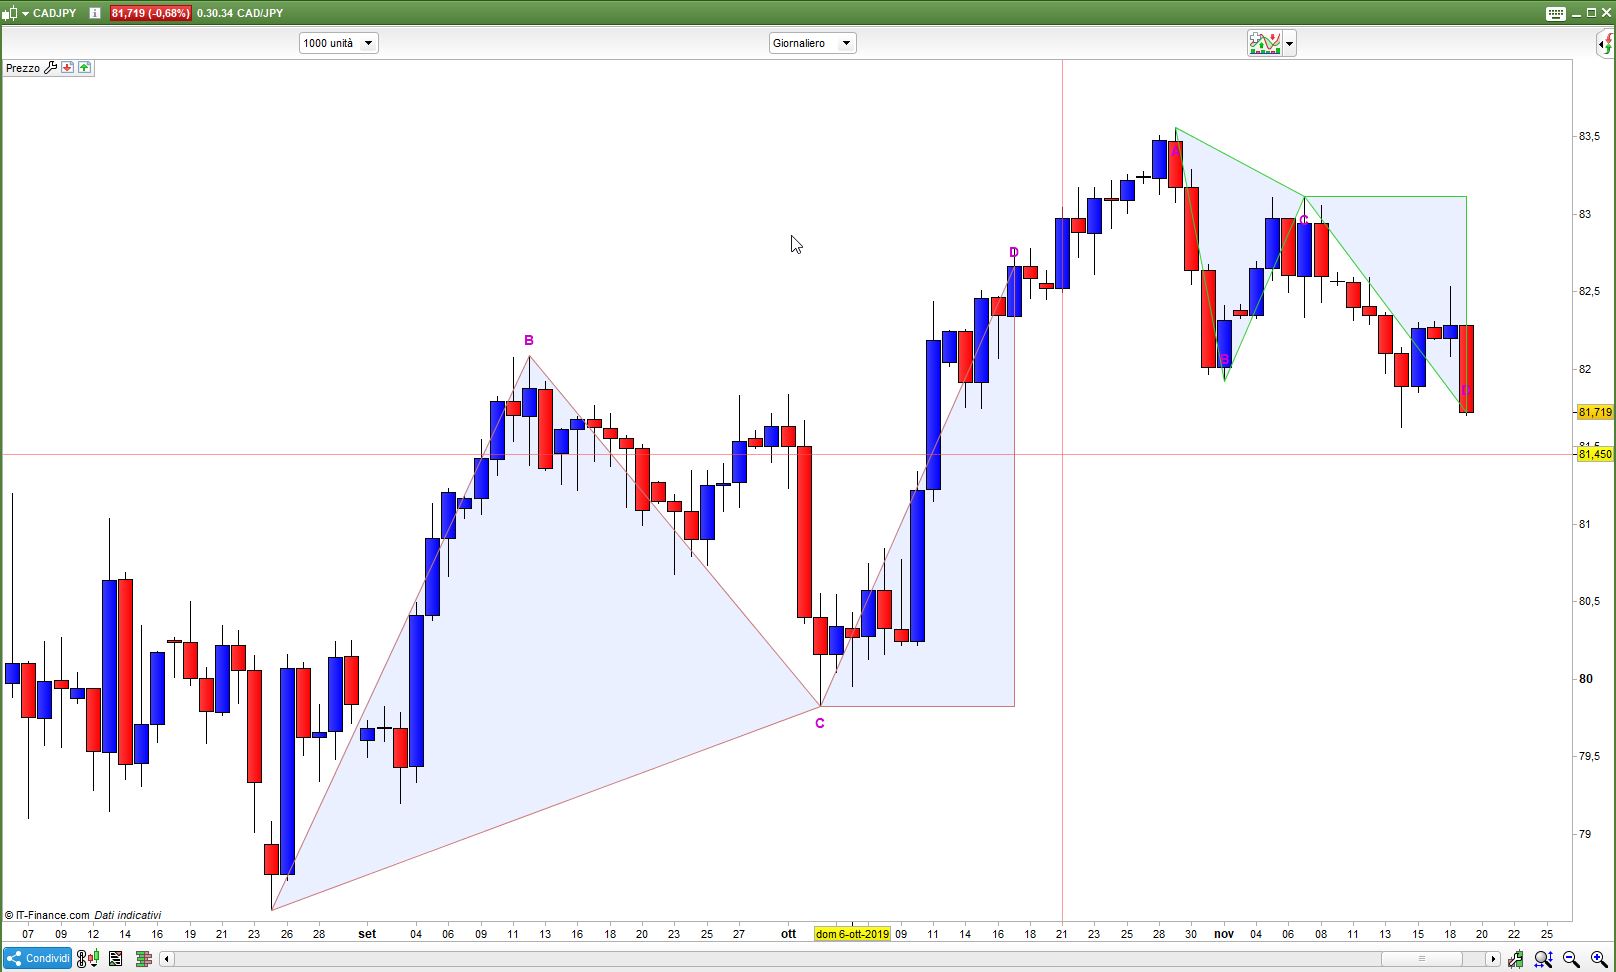
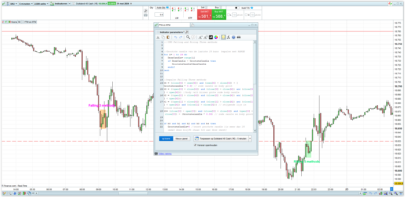
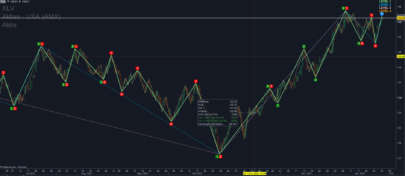
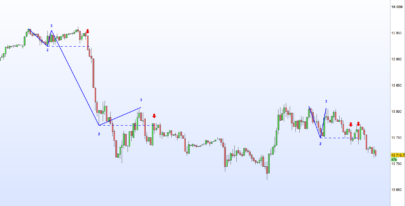
Based on a request in the italian support forum, it plots both Bullish and Bearish ABCD patterns on the chart.
Variables that can be set with the indicator’s properties:
- LmaxBars = 100 number of lookback bars
- LMinBars = 5 minimun number of bars between points A-C and C-D
- Ldistance = 15 offset to display letters on the chart
References:
https://www.prorealcode.com/topic/fibonacci-2/page/4/#post-108394
https://www.forex.com/en-uk/education/education-themes/technical-analysis/abcd-pattern/
|
1 2 3 4 5 6 7 8 9 10 11 12 13 14 15 16 17 18 19 20 21 22 23 24 25 26 27 28 29 30 31 32 33 34 35 36 37 38 39 40 41 42 43 44 45 46 47 48 49 50 51 52 53 54 55 56 57 58 59 60 61 62 63 64 65 66 67 68 69 70 71 72 73 74 75 76 77 78 79 80 81 82 83 84 85 86 87 88 89 90 91 92 93 94 95 96 97 98 99 100 101 102 103 104 105 106 107 108 109 110 111 112 113 114 115 116 117 118 119 120 121 122 123 124 125 126 127 128 129 130 131 132 133 134 135 136 137 138 139 140 141 142 143 144 145 146 147 148 149 150 151 152 153 154 155 156 157 158 159 160 161 162 163 164 165 166 167 168 169 170 171 172 173 174 175 176 177 178 179 180 181 182 183 184 185 186 187 188 189 190 191 192 193 194 195 196 197 198 199 200 201 202 203 204 205 206 207 208 209 210 211 212 213 214 215 216 217 218 219 220 221 222 223 224 225 226 227 228 229 230 231 232 233 234 235 236 237 238 239 240 241 242 243 244 245 246 247 248 249 250 251 252 253 254 255 256 257 258 259 260 261 262 263 264 265 266 267 268 269 270 271 272 273 274 275 276 277 278 279 280 281 282 283 284 285 286 287 288 289 290 291 292 293 294 295 296 297 298 299 300 301 302 303 304 305 306 307 308 309 310 311 312 313 314 315 316 317 318 319 320 321 322 323 324 325 326 327 328 329 330 331 332 333 334 335 336 337 338 339 340 341 342 343 344 345 346 347 348 349 350 351 352 353 354 355 356 357 358 359 360 361 362 363 364 365 366 367 368 369 370 371 372 373 374 375 376 377 378 379 380 381 382 383 384 385 386 387 388 389 390 391 392 393 394 395 396 397 398 399 400 401 402 403 404 405 406 407 408 409 410 411 412 413 414 415 416 417 418 419 420 421 422 423 |
DEFPARAM DrawOnLastBarOnly = true //LmaxBars = 100 //LMinBars = 5 //Ldistance = 15 //------------------------------------------------------------------------------------ // Bullish pattern //------------------------------------------------------------------------------------ IF BarIndex = 0 THEN Ldistance = Ldistance * pipsize LpointA = high LbarA = BarIndex LpointB = low LbarB = BarIndex LpointC = 0 LbarC = 0 LpointD = 0 LbarD = 0 Lcount = 0 XLpointA = 0 XLbarA = 0 XLpointB = 0 XLbarB = 0 XLpointC = 0 XLbarC = 0 XLpointD = 0 XLbarD = 0 ENDIF // IF Lcount > LmaxBars THEN XLpointA = LpointA XLbarA = LbarA XLpointB = LpointB XLbarB = LbarB XLpointC = LpointC XLbarC = LbarC XLpointD = LpointD XLbarD = LbarD LpointA = high LbarA = BarIndex LpointB = low LbarB = BarIndex LpointC = 0 LbarC = 0 LpointD = 0 LbarD = 0 Lcount = 0 ENDIF Lcount = Lcount + 1 //incrementare il passare delle Bars per azzerare tutto quando arriva a 100 // // Determinare se il prezzo scende sotto A, in tal caso avremo una nuova A più bassa e ripartiremo daccapo con B,C e D LpointA = max(LpointA,high) IF LpointA > LpointA[1] THEN LbarA = BarIndex Lcount = 0 LpointB = low LbarB = BarIndex LpointC = 0 LbarC = 0 LpointD = 0 LbarD = 0 ENDIF // // Determinare se il prezzo sale sopra B, in tal caso avremo una nuova B più alta e ripartiremo daccapo con C e D IF LpointC = 0 THEN LpointB = min(LpointB,low) IF LpointB < LpointB[1] THEN LbarB = BarIndex ENDIF ENDIF // Calcolare la differenza tra i punti A e B e le due percentuali di fibonacci da usare per la verifica di C LdiffAB = LpointA - LpointB LfibC1 = LdiffAB * 0.618 LfibC2 = LdiffAB * 0.786 LfibD1 = LpointC - (LfibC1 * 1.270) LfibD2 = LpointC - (LfibC2 * 1.618) IF high >= (LpointB + LfibC1) AND high <= (LpointB + LfibC2) THEN // se il MINIMO è tra 0.618 e 0.786 abbiamo trovato il Lpoint C.... LpointC = high LbarC = BarIndex IF LpointC < LpointC[1] THEN LpointC = LpointC[1] LbarC = LbarC[1] ENDIF ELSIF close > (LpointB + LfibC2) THEN // ...altrimenti si riparte daccapo con un nuovo Lpoint A ed un nuovo Lpoint B LpointA = high LbarA = BarIndex LpointB = low LbarB = BarIndex LpointC = 0 LbarC = 0 LbarD = 0 LpointD = 0 Lcount = 0 ENDIF // // Una volta superato il 161.8 si riparte daccapo // IF close < LfibD2 AND LpointD > 0 THEN XLpointA= LpointA XLbarA = LbarA XLpointB= LpointB XLbarB = LbarB XLpointC= LpointC XLbarC = LbarC XLpointD= LpointD XLbarD = LbarD LpointA = high LbarA = BarIndex LpointB = low LbarB = BarIndex LpointC = 0 LbarC = 0 LpointD = 0 LbarD = 0 Lcount = 0 ENDIF IF LpointC > 0 THEN IF LpointD = 0 THEN IF close <= LfibD1 AND close >= LfibD2 THEN LpointD = close LbarD = BarIndex ELSIF close < LfibD2 THEN LpointD = LfibD2 LbarD = BarIndex ENDIF ELSE IF close <= LfibD1 AND close >= LfibD2 THEN LpointD = close IF LpointD < LpointD[1] THEN LbarD = BarIndex ELSE LpointD = LpointD[1] ENDIF ELSE XLpointA= LpointA XLbarA = LbarA XLpointB= LpointB XLbarB = LbarB XLpointC= LpointC XLbarC = LbarC XLpointD= LpointD XLbarD = LbarD LpointA = high LbarA = BarIndex Lcount = 0 LpointB = 0 LbarB = 0 LpointC = 0 LbarC = 0 LpointD = 0 LbarD = 0 ENDIF ENDIF ENDIF // si stampano i punti trovati, ognuno dipendente dal precedente, si stampa A, poi B solo se A è stato stampato, poi C solo se B è stato stampato ed infine D se anche C è stato stampato IF LpointC > 0 THEN IF ((LbarC - LbarA) < LminBars ) THEN LpointC = 0 x = BarIndex - LbarB FOR i = x DOWNTO 0 IF low[i] < LpointB THEN LpointB = low[i] LbarB = BarIndex[i] ENDIF NEXT ENDIF ENDIF //IF LpointD > 0 THEN //IF ((LbarC - LbarA) < LminBars ) OR ((LbarD - LbarC) < LminBars ) THEN //LpointD = 0 //ENDIF //ENDIF IF LpointA > 0 THEN IF LpointB > 0 THEN IF LpointC > 0 THEN IF LpointD > 0 THEN //IF LpointD[1] = 0 THEN XLpointA = LpointA XLbarA = LbarA XLpointB = LpointB XLbarB = LbarB XLpointC = LpointC XLbarC = LbarC XLpointD = LpointD XLbarD = LbarD //ENDIF DRAWTEXT("A",LbarA,LpointA - Ldistance,Dialog,Bold,14) coloured(205,0,205,255) DRAWTEXT("B",LbarB,LpointB + Ldistance,Dialog,Bold,14) coloured(205,0,205,255) DRAWTEXT("C",LbarC,LpointC - Ldistance,Dialog,Bold,14) coloured(205,0,205,255) DRAWTEXT("D",LbarD,LpointD + Ldistance,Dialog,Bold,14) coloured(205,0,205,255) DRAWTRIANGLE(LbarA,LpointA,LbarB,LpointB,LbarC,LpointC)coloured(50,205,50,255) DRAWTRIANGLE(LbarC,LpointC,LbarD,LpointC,LbarD,LpointD)coloured(50,205,50,255) ENDIF ENDIF ENDIF ENDIF IF LpointD = 0 AND XLpointD > 0 THEN DRAWTEXT("A",XLbarA,XLpointA - Ldistance,Dialog,Bold,14) coloured(205,0,205,255) DRAWTEXT("B",XLbarB,XLpointB + Ldistance,Dialog,Bold,14) coloured(205,0,205,255) DRAWTEXT("C",XLbarC,XLpointC - Ldistance,Dialog,Bold,14) coloured(205,0,205,255) DRAWTEXT("D",XLbarD,XLpointD + Ldistance,Dialog,Bold,14) coloured(205,0,205,255) DRAWTRIANGLE(XLbarA,XLpointA,XLbarB,XLpointB,XLbarC,XLpointC)coloured(50,205,50,255) DRAWTRIANGLE(XLbarC,XLpointC,XLbarD,XLpointC,XLbarD,XLpointD)coloured(50,205,50,255) ENDIF //------------------------------------------------------------------------------------ // Bearish pattern //------------------------------------------------------------------------------------ SmaxBars = LmaxBars SminBars = LminBars Sdistance = Ldistance IF BarIndex = 0 THEN SpointA = low SbarA = BarIndex SpointB = high SbarB = BarIndex SpointC = 0 SbarC = 0 SpointD = 0 SbarD = 0 Scount = 0 XSpointA = low XSbarA = BarIndex XSpointB = high XSbarB = BarIndex XSpointC = 0 XSbarC = 0 XSpointD = 0 XSbarD = 0 ENDIF // IF Scount > SmaxBars THEN XSpointA = SpointA XSbarA = SbarA XSpointB = SpointB XSbarB = SbarB XSpointC = SpointC XSbarC = SbarC XSpointD = SpointD XSbarD = SbarD SpointA = low SbarA = BarIndex SpointB = high SbarB = BarIndex SpointC = 0 SbarC = 0 SpointD = 0 SbarD = 0 Scount = 0 ENDIF Scount = Scount + 1 //incrementare il passare delle Bars per azzerare tutto quando arriva a 100 // // Determinare se il prezzo scende sotto A, in tal caso avremo una nuova A più bassa e ripartiremo daccapo con B,C e D SpointA = min(SpointA,low) IF SpointA < SpointA[1] THEN SbarA = BarIndex Scount = 0 SpointB = high SbarB = BarIndex SpointC = 0 SbarC = 0 SpointD = 0 SbarD = 0 ENDIF // // Determinare se il prezzo sale sopra B, in tal caso avremo una nuova B più alta e ripartiremo daccapo con C e D IF SpointC = 0 THEN SpointB = max(SpointB,high) IF SpointB > SpointB[1] THEN SbarB = BarIndex ENDIF ENDIF // Calcolare la differenza tra i punti A e B e le due percentuali di fibonacci da usare per la verifica di C SdiffAB = SpointB - SpointA SfibC1 = SdiffAB * 0.618 SfibC2 = SdiffAB * 0.786 SfibD1 = SpointC + (SfibC1 * 1.270) SfibD2 = SpointC + (SfibC2 * 1.618) IF low <= (SpointB - SfibC1) AND low >= (SpointB - SfibC2) THEN // se il MINIMO è tra 0.618 e 0.786 abbiamo trovato il Spoint C.... SpointC = low SbarC = BarIndex IF SpointC < SpointC[1] THEN SpointC = SpointC[1] SbarC = SbarC[1] ENDIF ELSIF close < (SpointB - SfibC2) THEN // ...altrimenti si riparte daccapo con un nuovo Spoint A ed un nuovo Spoint B SpointA = low SbarA = BarIndex SpointB = high SbarB = BarIndex SpointC = 0 SbarC = 0 SbarD = 0 SpointD = 0 Scount = 0 ELSIF close > SpointB THEN //SpointB = high //SbarB = BarIndex //SpointC = 0 //SbarC = 0 //SbarD = 0 //SpointD = 0 ENDIF // // Una volta superato il 161.8 si riparte daccapo // IF close > SfibD2 AND SpointD > 0 THEN XSpointA= SpointA XSbarA = SbarA XSpointB= SpointB XSbarB = SbarB XSpointC= SpointC XSbarC = SbarC XSpointD= SpointD XSbarD = SbarD SpointA = low SpointA = low SbarA = BarIndex SpointB = high SbarB = BarIndex SpointC = 0 SbarC = 0 SpointD = 0 SbarD = 0 Scount = 0 ENDIF IF SpointC > 0 THEN IF SpointD = 0 THEN IF close >= SfibD1 AND close <= SfibD2 THEN SpointD = close SbarD = BarIndex ELSIF close > SfibD2 THEN SpointD = SfibD2 SbarD = BarIndex ENDIF ELSE IF close >= SfibD1 AND close <= SfibD2 THEN SpointD = close IF SpointD > SpointD[1] THEN SbarD = BarIndex ELSE SpointD = SpointD[1] ENDIF ELSE XSpointA= SpointA XSbarA = SbarA XSpointB= SpointB XSbarB = SbarB XSpointC= SpointC XSbarC = SbarC XSpointD= SpointD XSbarD = SbarD SpointA = low SbarA = BarIndex Scount = 0 SpointB = 0 SbarB = 0 SpointC = 0 SbarC = 0 SpointD = 0 SbarD = 0 ENDIF ENDIF ENDIF // si stampano i punti trovati, ognuno dipendente dal precedente, si stampa A, poi B solo se A è stato stampato, poi C solo se B è stato stampato ed infine D se anche C è stato stampato IF SpointC > 0 THEN IF ((SbarC - SbarA) < SminBars ) THEN SpointC = 0 x = BarIndex - SbarB FOR i = x DOWNTO 0 IF high[i] > SpointB THEN SpointB = high[i] SbarB = BarIndex[i] ENDIF NEXT ENDIF ENDIF IF SpointD > 0 THEN IF ((SbarD - SbarC) < SminBars ) THEN //IF SpointD > 0 THEN //IF ((SbarC - SbarA) < SminBars ) OR ((SbarD - SbarC) < SminBars ) THEN //SpointD = 0 //ENDIF //ENDIF SpointD = 0 SbarD = 0 ENDIF ENDIF IF SpointA > 0 THEN IF SpointB > 0 THEN IF SpointC > 0 THEN IF SpointD > 0 THEN //IF SpointD[1] = 0 THEN XSpointA = SpointA XSbarA = SbarA XSpointB = SpointB XSbarB = SbarB XSpointC = SpointC XSbarC = SbarC XSpointD = SpointD XSbarD = SbarD //ENDIF DRAWTEXT("A",SbarA,SpointA - Sdistance,Dialog,Bold,14) coloured(205,0,205,255) DRAWTEXT("B",SbarB,SpointB + Sdistance,Dialog,Bold,14) coloured(205,0,205,255) DRAWTEXT("C",SbarC,SpointC - Sdistance,Dialog,Bold,14) coloured(205,0,205,255) DRAWTEXT("D",SbarD,SpointD + Sdistance,Dialog,Bold,14) coloured(205,0,205,255) DRAWTRIANGLE(SbarA,SpointA,SbarB,SpointB,SbarC,SpointC)coloured(200,120,120,255) DRAWTRIANGLE(SbarC,SpointC,SbarD,SpointC,SbarD,SpointD)coloured(200,120,120,255) ENDIF ENDIF ENDIF ENDIF IF SpointD = 0 AND XSpointD > 0 THEN DRAWTEXT("A",XSbarA,XSpointA - Sdistance,Dialog,Bold,14) coloured(205,0,205,255) DRAWTEXT("B",XSbarB,XSpointB + Sdistance,Dialog,Bold,14) coloured(205,0,205,255) DRAWTEXT("C",XSbarC,XSpointC - Sdistance,Dialog,Bold,14) coloured(205,0,205,255) DRAWTEXT("D",XSbarD,XSpointD + Sdistance,Dialog,Bold,14) coloured(205,0,205,255) DRAWTRIANGLE(XSbarA,XSpointA,XSbarB,XSpointB,XSbarC,XSpointC)coloured(200,120,120,255) DRAWTRIANGLE(XSbarC,XSpointC,XSbarD,XSpointC,XSbarD,XSpointD)coloured(200,120,120,255) ENDIF RETURN |
Share this
No information on this site is investment advice or a solicitation to buy or sell any financial instrument. Past performance is not indicative of future results. Trading may expose you to risk of loss greater than your deposits and is only suitable for experienced investors who have sufficient financial means to bear such risk.
ProRealTime ITF files and other attachments :PRC is also on YouTube, subscribe to our channel for exclusive content and tutorials




Thanks Roberto, amazing job as your usual.
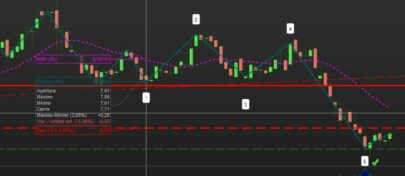
Only one question is the final configuration when it is visible on the chart so to speak (C D).
Bellissimo lavoro, Roberto, congratulazioni. C’è un unico piccolo/grande problema: imparare a usare il pattern ABCD.
Ceecando su internet troverai molte spiegazioni.
In due parole quando si forma la D di entra in direzione opposta, ovviamente valutando sempre anche altre condizioni.
A parte ho pubblicato anche il relativo screener.
Grazie anche per lo screener, mi studierò per bene questo pattern armonico.
Ottimo lavoro, una sola curiosità: è possibile settare il riempimento dei triangoli? A me compaiono solo i segmenti che compongono il perimetro. Grazie
No, il colore interno non si può cambiare con la versione 10.3, si potrà dalla 11, per ora disponibile solo con PRT, che non ho, mentre IG ad anno nuovo, ma non so in che mese.
Però dovresti vedere il colore di default, prova a scurire o schiarire il monitor.
Grazie per il riscontro, io per ora uso la versione beta 11.1. Che tu sappia, c’è qualche istruzione specifica da inserire nel codice per mettere il colore interno?
https://www.prorealcode.com/blog/prorealtime-v11-new-instructions-and-improvements-in-calculation-speed/
hello , is it possible to see the patterns back in time? i tried to adjust the loockback value bit it dident draw anything in historical data.
Grazie mille per la risposta. Avrei un’altra domanda (un po’ off topic). Quando su esaminano i risultati di un trading system (probacktest) è possibile plottare (nella finestrella curva guadagni-perdite) o, comunque, far apparire il ratio gain/loss, senza dover aprire la finestrella del rapporto dettagliato. Sarebbe comodo, ad esempio se si confrontano più trading system, avere il parametro gain/loss evidenziato nei relativi grafici (in modo da non avere troppe finestre aperte). Sai se c’è qualche comando da inserire nel trading system o settaggio di prorealtime che permetta di rendere immediatamente visibile il parametro gain/loss? – Grazie per l’attenzione
Try uncommenting line 1, to see what happens.
Crea un topic nel supporto ProOrder, per favore. Grazie
I’m using V10.3 with IG and whenever I’m importing an indicator it doesnt overlay on the chart, but goes into a new panel. Do you know how to fix this?
Is this compatible with IBKR PRT platform? how can i get a tutorial of IBKR coding?
I don’t know, if you have a demo account on it you can try. I don’t have it, sorry.
Thank you Roberto for the link. I will try to run it tomorrow.
Toby
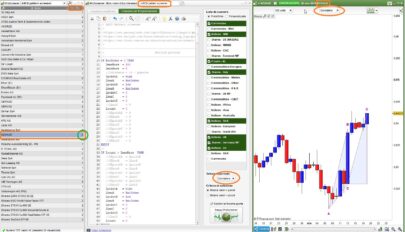
Hi Roberto, I have imported the file, but instead of overlaying my main price tab, I get a separate tab at the bottom of the window? how do I overlap the pattern indicator on to the price screen? thank you in advance
Click the spanner on the upper left corner of your chart, then add an indicator from the list..
Thank you Roberto. You have just changed my world! ha
I have another question regarding the indicator, it only forms after the D has closed, is there a way to only have an ABC indicator, which will enable with DD a decision on the buy or sell direction for the D (from ABCD)?
Comment out lines 394, 411, 408, 410, 419 and 421.
This should do, but also try replacing line 15 with:
“SpointC = 0 AND XSpointC > 0”.
Hi Roberto, thanks for the codes. I have added the indicator in V10.3; I can see the triangles but the letters ABCD is plotting way far in the chart and not next to the angles. Any tricks how to tune this up. Thanks in advance.
Thank you so much, appreciate alot. Can you explain witch symbol I use to set up in alerts? >, >=, => , = ….obviously not cross over or cross under.
Thank you
Like my screener https://www.prorealcode.com/prorealtime-market-screeners/abcd-pattern-screener/
Thanks for your work.
I’m using V11 and nothing is drawn on the chart, I believe this is a compatibility issue, so : What would it need to be compatible with V11?
It works on v10.3, v11 and v12. You are likely to have added it BELOW your chart (like RSI), try adding it ON your chart (like a Moving Average).