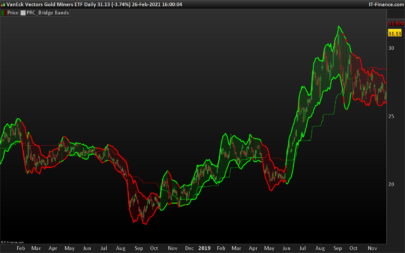
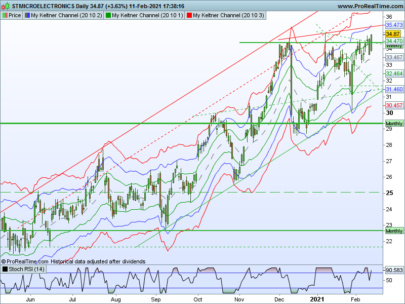
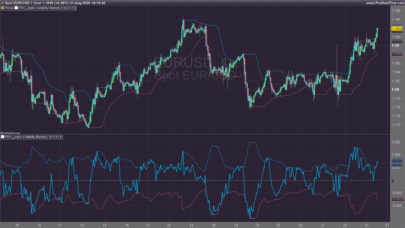
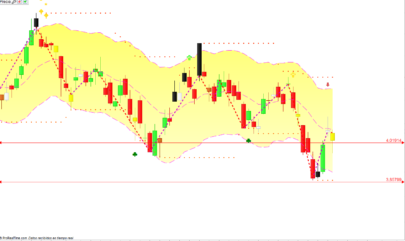
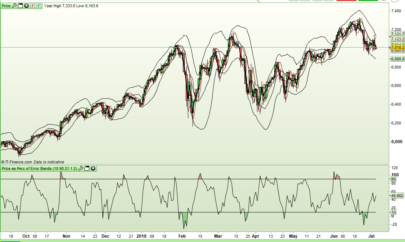
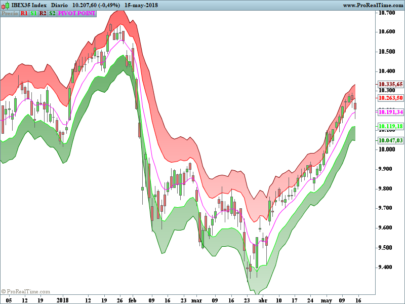
This indicator created by Price Headley is described in his book “Big Trends in Trading“. It acts as a enveloppe bands indicator. It can be used in any timeframe on typical 20 and 80 periods. It is more effective on stocks trading. The wider the bands are, greater is the volatility and you should expect trend continuation.
Buy signals are taken while the price make consecutive upper bands piercing.
|
1 2 3 4 5 6 7 8 |
upper = (High*(1+2*(((High-Low)/((High+Low)/2))*1000)*0.001)) lower = (Low*(1-2*(((High-Low)/((High+Low)/2))*1000)*0.001)) BUP = average[20](upper) BDOWN = average[20](lower) RETURN BUP as "Upper Acceleration Band", BDOWN as "Lower Acceleration Band" |
Share this
No information on this site is investment advice or a solicitation to buy or sell any financial instrument. Past performance is not indicative of future results. Trading may expose you to risk of loss greater than your deposits and is only suitable for experienced investors who have sufficient financial means to bear such risk.
ProRealTime ITF files and other attachments :PRC is also on YouTube, subscribe to our channel for exclusive content and tutorials


