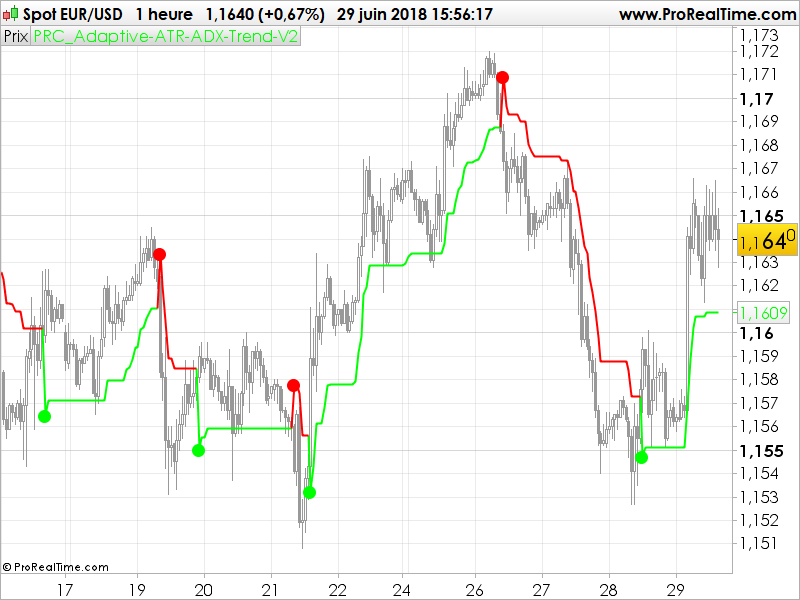
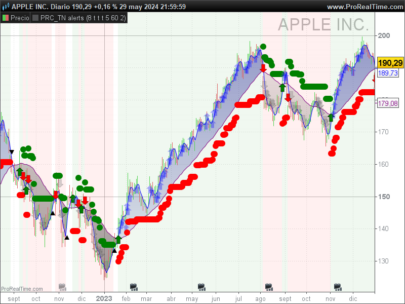
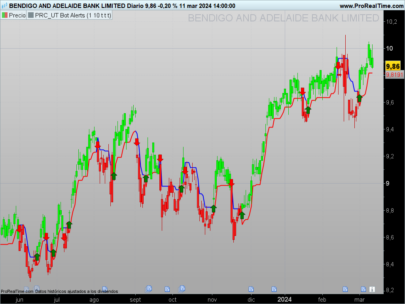
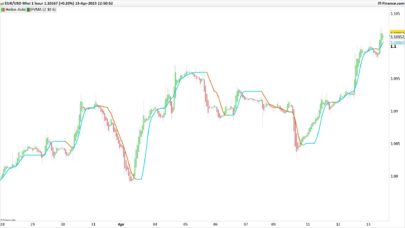
Constructs the trailing ATR stop above or below the price, and switches
directions when the source price breaks the ATR stop. Uses the Average
Directional Index ( ADX ) to switch between ATR multipliers. The higher
multiplier is used when the ADX is rising, and the lower ATR multiplier
is used with the ADX is falling. This ADX criteria further widens the gap
between the source price and the trailing ATR stop when the price is trending,
and lessens the gap between the ATR and the price when then price is not
trending.
The ATR-ADX stop is effectively a double adapative stop that trails the price,
by both adapting to the true range of the price, and the average directional
change. When the stop is below the price (long trade) the value never decreases
until the price intersects the stop, and it reverses to being above the price
(short trade). When the stop is above the price it will never increase until
it is intersected by the price. As the true range and ADX change, the stop
will move more quickly or more slowly.
First, if the ‘Above Threshold’ box is checked,the falling (smaller) multiplier
will be used regardless once the ADX rises above a certain threshold (default > 30).
The ATR will effectively rise faster once the price enters ‘very trendy’ mode.
Typically, ADX > 20/25 is used in classic ADX trading (which I have found
unprofitable through backtesting). The idea behind this extra multiplier criteria
is that once the price starts trending ‘very’ well, a top/bottom is likely near,
and when that top comes the price will quickly rebound. Experienced traders know
exactly what I am describing. Play around with an ADX/DI indicator using this
stop system in tandem and it will be found that many successful trades are entered
when the market is not trending (i.e. < ADX < 25), and exited once/if the price
enters ‘very trendy’ mode above 30 and the ATR changes (stopped out).
Second, heiken-ashi bars can be introduced to the ATR stop system. This is the same
thing as just switching the chart to Heiken Ashi mode, but without having to change
the plotting type. I find this useful, so that things like pivot lines can be
preserved to their correct calculations, while the benefit of heiken ashi bars can
still be enjoyed. Be advised that with each tinkering that extends the life of the
ATR trend, the odds of that same trend changing near the top/bottom are reduced,
so as always there is a trade-off to maximize the time spend in a trade and nailing
a top or bottom.
Third, Different source prices can be used. I have found that HLC3 is best because
it keeps the price from being stopped out in very key areas, set as the default.
Fourth, alert conditions are introduced so that the trader can be warned when the
ATR-ADX changes. These can be used by right clicking the strategy and clicking
“Add Alert…”. Reference the bottom of the script for the names of the alert
conditions.
(original code and description from its author: mortdiggiddy, all credits goes to him).
Code translated from TradingView (pinescript) code by a request in the english forum.
|
1 2 3 4 5 6 7 8 9 10 11 12 13 14 15 16 17 18 19 20 21 22 23 24 25 26 27 28 29 30 31 32 33 34 35 36 37 38 39 40 41 42 43 44 45 46 47 48 49 50 51 52 53 54 55 56 57 58 59 60 61 62 63 64 65 66 67 68 69 70 71 72 73 74 75 76 77 78 79 80 81 82 83 84 85 86 87 88 89 90 91 92 93 94 95 96 97 98 99 100 101 102 103 104 105 106 107 108 109 110 111 112 113 114 115 116 117 118 119 120 121 122 123 124 125 126 127 128 129 130 131 132 133 134 135 136 137 |
//PRC_Adaptive-ATR-ADX-Trend-V2 | indicator //29.06.2017 //Nicolas @ www.prorealcode.com //Sharing ProRealTime knowledge //translated from tradingview code // --- settings atrLen = 21 m1 = 3.5 //"ATR Multiplier - ADX Rising" m2 = 1.75 //"ATR Multiplier - ADX Falling" adxLen = 14 adxThresh = 30 //"ADX Threshold" aboveThresh = 1 //true, title = "ADX Above Threshold uses ATR Falling Multiplier Even if Rising?") useHeiken = 1 //(false, title = "Use Heiken-Ashi Bars (Source will be ohlc4)") // --- end of settings source = MedianPrice // DI-Pos, DI-Neg, ADX hR = high-high[1] lR = -(low-low[1]) if hr>lr then dmPos=max(hr,0) else dmPos=0 endif if lr>hr then dmNeg=max(lr,0) else dmNeg=0 endif sTR = (sTR[1] - sTR[1]) / adxLen + tr sDMPos = (sDMPos[1] - sDMPos[1]) / adxLen + dmPos sDMNeg = (sDMNeg[1] - sDMNeg[1]) / adxLen + dmNeg DIP = sDMPos / sTR * 100 DIN = sDMNeg / sTR * 100 DX = abs(DIP - DIN) / (DIP + DIN) * 100 aadx = average[adxLen](DX) // Heiken-Ashi if barindex<2 then xClose = close xOpen = open else xClose = TotalPrice xOpen = (xOpen[1] + close[1]) / 2 endif xHigh = max(high, max(xOpen, xClose)) xLow = min(low, min(xOpen, xClose)) // Trailing ATR v1 = abs(xHigh - xClose[1]) v2 = abs(xLow - xClose[1]) v3 = xHigh - xLow trueRange = max(v1, max(v2, v3)) if useHeiken then atr = WilderAverage[atrLen](trueRange) else atr = AverageTrueRange[atrLen] endif if aadx>aadx[1] and (adx < adxThresh or not aboveThresh) then m=m1 elsif aadx<aadx[1] or (adx > adxThresh and aboveThresh) then m=m2 else m = m[1] endif if DIP >= DIN then mUp=m else mUp=m2 endif if DIN >= DIP then mDn=m else mDn=m2 endif if useHeiken then src=xClose c=Xclose t=(xHigh+xLow)/2 else src=source c=close t=MedianPrice endif up = t - mUp * atr dn = t + mDn * atr if max(src[1], c[1]) > TUp[1] then TUp = max(up,TUp[1]) else TUp = up endif if min(src[1], c[1]) < TDown[1] then TDown = min(dn, TDown[1]) else TDown = dn endif //trend if min(src,min(c,close))>TDown[1] then trend=1 elsif max(src,max(c,close))<TUp[1] then trend=-1 else trend=trend[1] endif if trend=1 then sstop=TUp r=0 g=255 else sstop=TDown r=255 g=0 endif if trend<>trend[1] then drawtext("•",barindex,sstop,Dialog,Standard,30) coloured(r,g,0) endif return sstop coloured(r,g,0) style(line,2) |
Share this
No information on this site is investment advice or a solicitation to buy or sell any financial instrument. Past performance is not indicative of future results. Trading may expose you to risk of loss greater than your deposits and is only suitable for experienced investors who have sufficient financial means to bear such risk.
ProRealTime ITF files and other attachments :PRC is also on YouTube, subscribe to our channel for exclusive content and tutorials






Thanks Nicolas !
Merci beaucoup pour cette contribution au catalogue des stops.
Thx Nicolas! trying to test this indicator in an automated strategy but I’m becoming crazy because when I call the indicator and then simply Graph it in the chart result, there is a discrepency in the value of the indicator vs it’s “called” version in the strategy. How is that possible? In the strategy I’m calling it via the command
In this case, I suggest to add the indicator’s code directly into your strategy.
mystoploss=call “Adaptative ATR-ADX”(MedianPrice)
GRAPH mystoploss as “Adapt”
Nicolas, Could you explain lines 35, 37 and 38 please. Unless I’m missing something they can result in a division by zero attempt.
Should not if adxlen variable is superior to 0.
Nicolas, Can you explain the numerator logic – e.g. Line 35 is (sTR[1] – sTR[1]) which would appear to be either null or zero.
You are right, this is useless. Since I converted it from another programming language, I assume it was in the original code…
bonjour nicolas j’aime bcoup votre indicateur
Script ‘Adaptive ATR’ has been saved
line 24: no viable alternative at input ‘lr’
Getting above error. Please help to resolve the same.
download the itf file and import it into your platform.
Bonjour à tous,
J’aime beaucoup cet indicateur et j’aimerais pouvoir l’utiliser sur la dernière version de prorealtime V12 avec l’option “Utiliser une autre pèriode” cad pouvoir, par exemple, visualiser l’indicateur en 3mn sur un graph 2mn.
Quelqu’un pourrait-il m’aider ?
Merci d’avance.
Bonne journée.
Fran6