Introduction
I have worked on a collection of indicators with a view to reducing the number of false signals in classic oscillators such as RSI, Stochastic and more. My ADX Weighted RSI is one such indicator. I thought to share it here in case someone would like to contribute with further ideas.
What and why?
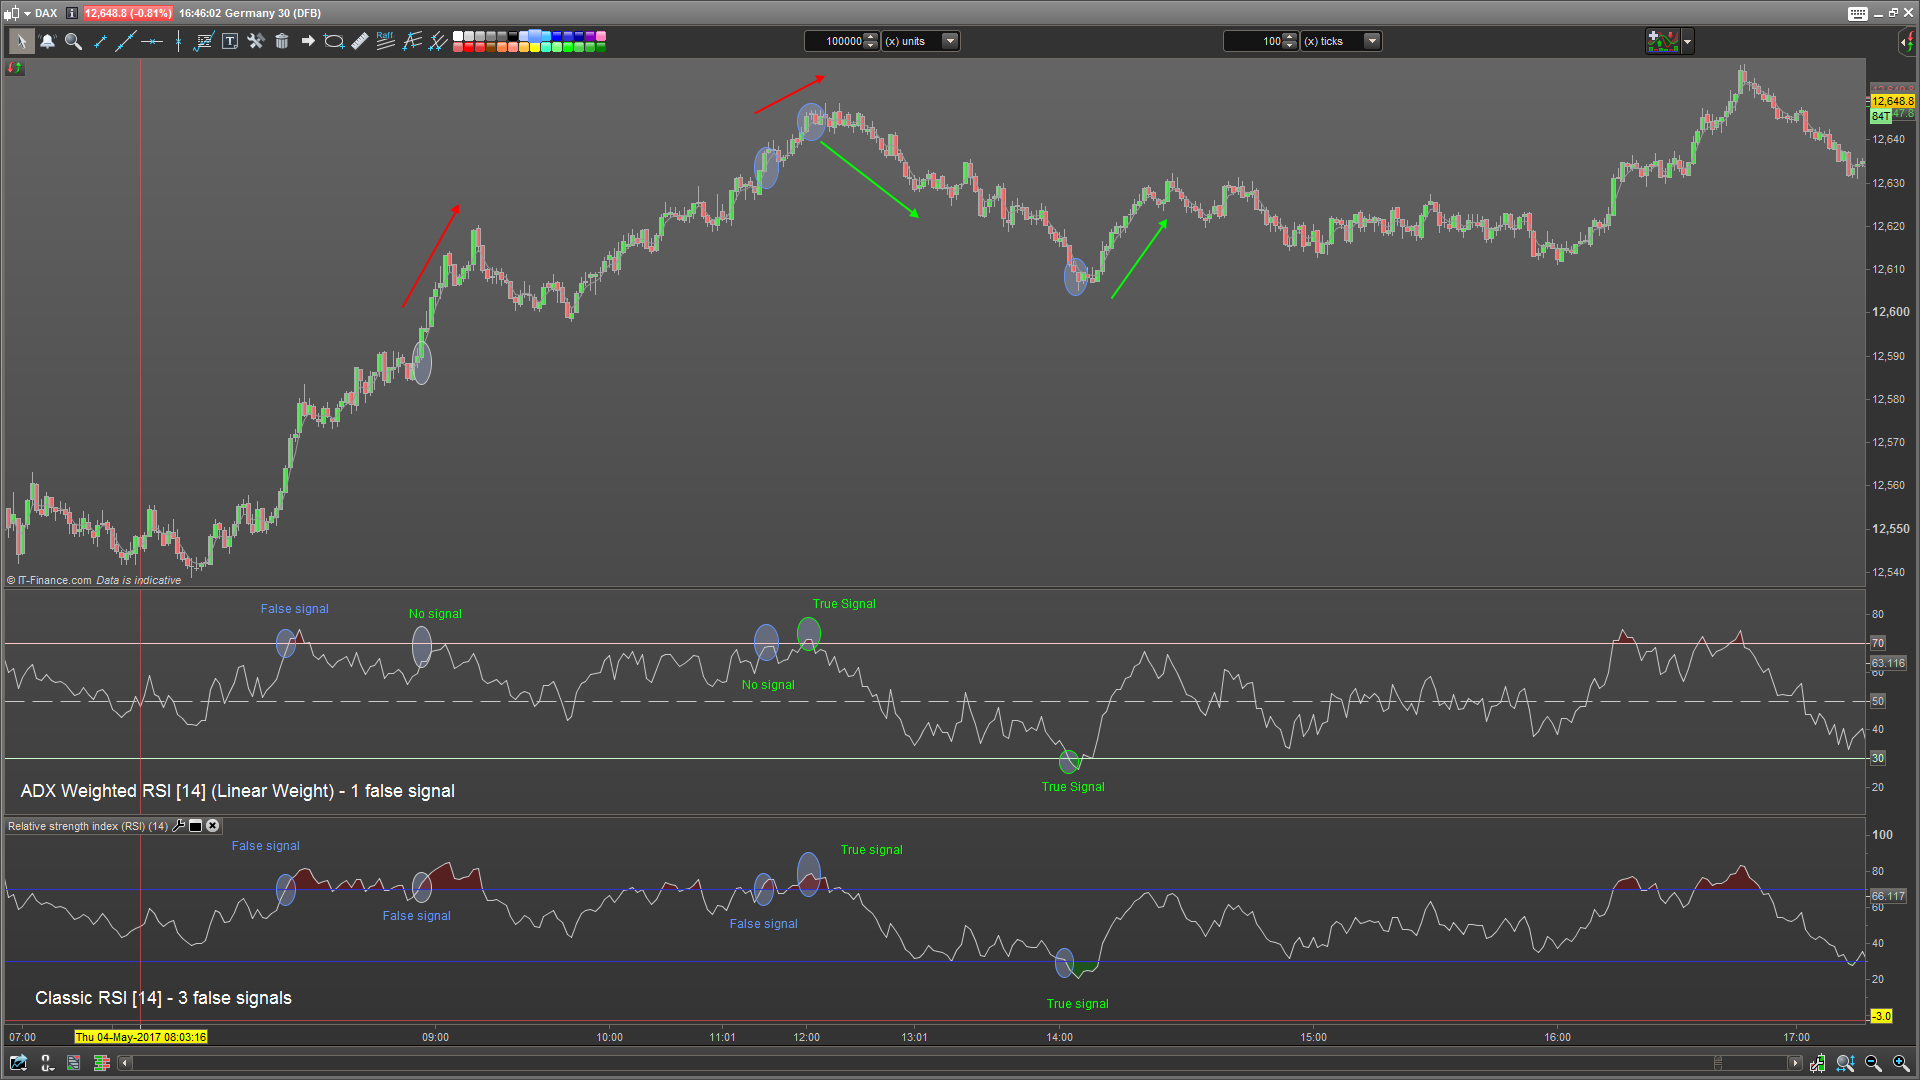
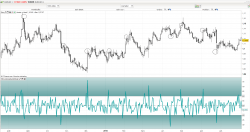
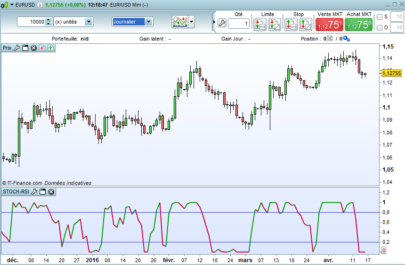
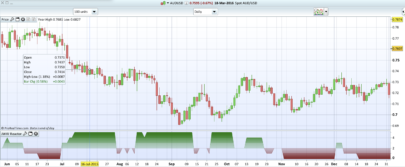
ADX Weighted RSI attempts to reduce the number of false signals generated by the classic RSI. Interpretation of the indicator is the same as the classic RSI. When markets are trending, overbought and oversold signals form the classic RSI become false. This aims to limit ob/os signals during strong trends where the likelihood of reversal is lower. Improving classic oscillators is a slight alternative to creating new oscillator functions and can become useful in algorithmic trading.
More detail
The classic RSI works best during sideways or consolidating markets but is far less useful in trending markets. Various functions are available to determine trend strength. In this case I using the ADX function to determine trend strength due to its simplicity and speed. (FDI is also a good filtering option but that’s another topic; forum topic opened with link to be posted below) We attenuate premature overbought or oversold signals in RSI if the trend shown by ADX is strong and/or strengthening.
RSI signal attenuation is linear in the case of this indicator; linear between a minimum ADX of 23 (no attenuation) and a maximum ADX of 70 (full attenuation). The ADX signal is normalized in a linear way and then used to affect the RSI signal. It is also possible to apply logarithmic, quadratic or parabolic curves to the attenuation signal so that the affect on RSI dampening might be further aligned with market dynamics. This version published here however is a simple version without such curves and attenuates linear fashion.
There is much more room for discussion on this topic. Many more options exist for dampening techniques – how it’s applied and how it’s lifted off. I am publishing this very simple version for the time being. More advanced versions exist – feel free to get in touch if you would like to discuss or contribute.
Variables
period – RSI period in bars
adxPeriod – ADX period in bars
weightingPC – By how much % to dampen.
– 100 = full damping
– 0 = no damping
– <100 = amplification!
– >100 = squashing
Note – this indicator is best optimized for your market or time frame.
|
1 2 3 4 5 6 7 8 9 10 11 12 13 14 15 16 17 18 19 20 21 22 23 24 25 26 27 28 29 30 |
//------------------------------------------- // Indicator: ADX Weighted RSI (Linear) // Author: Maz @ prorealcode // Version 1.01 beta //------------------------------------------- // period = 14 // rsi period // adxPeriod = 14 // adx period // weightingPC = 80 // % percentage of RSI being affected once adxMin = 23 once adxMax = 70 once adxRange = (adxMax-adxMin) once weighting = weightingPC / 100 a = adx[adxPeriod] r = rsi[period](customClose) // bring rsi down to revolve around zero if a < adxr[adxPeriod] then // ADX falling so do not apply throttle result = r else // ADX is rising so apply RSI throttle rZero = r-50 // Shift rzi to revolve around zero a = min(adxMax, max(adxMin, a)) // Clip ADX to max and min aNorm = 1- ( (((a-adxMin)/adxRange) / 1.5 ) * weighting ) // normalise between 0 and 1, weight by weighting and invert. Also Squash it a bit (/1.5) - squashing experimental //aNorm = 1- ( (((a-adxMin)/adxRange) ) * weighting ) // Don't squash (no /1.5) result = (rZero * aNorm) + 50 // Attenuate RSI by multiplying with ADX. Bring back to rotate around 50 endif return result as "ADX Weighted RSI", 30 coloured(200, 255, 200) as "30", 50 style(dottedline, 1) as "50", 70 coloured(255, 200, 200) as "70" |
Share this
No information on this site is investment advice or a solicitation to buy or sell any financial instrument. Past performance is not indicative of future results. Trading may expose you to risk of loss greater than your deposits and is only suitable for experienced investors who have sufficient financial means to bear such risk.
ProRealTime ITF files and other attachments :
Find other exclusive trading pro-tools on ![]()
PRC is also on YouTube, subscribe to our channel for exclusive content and tutorials


very nice, thanks!
Interesting! Thanks for sharing!
Extremely nice, thanks!