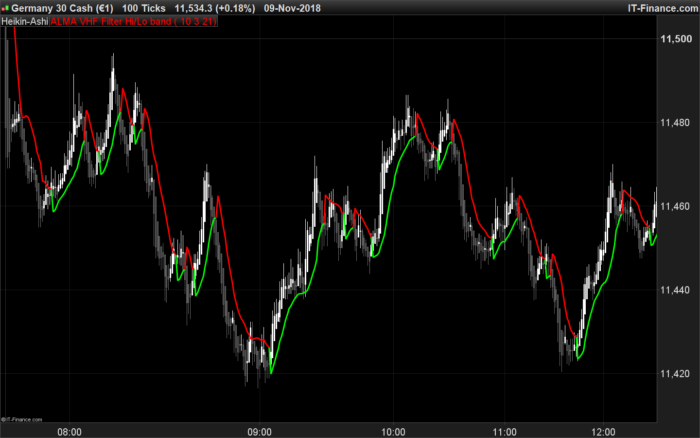
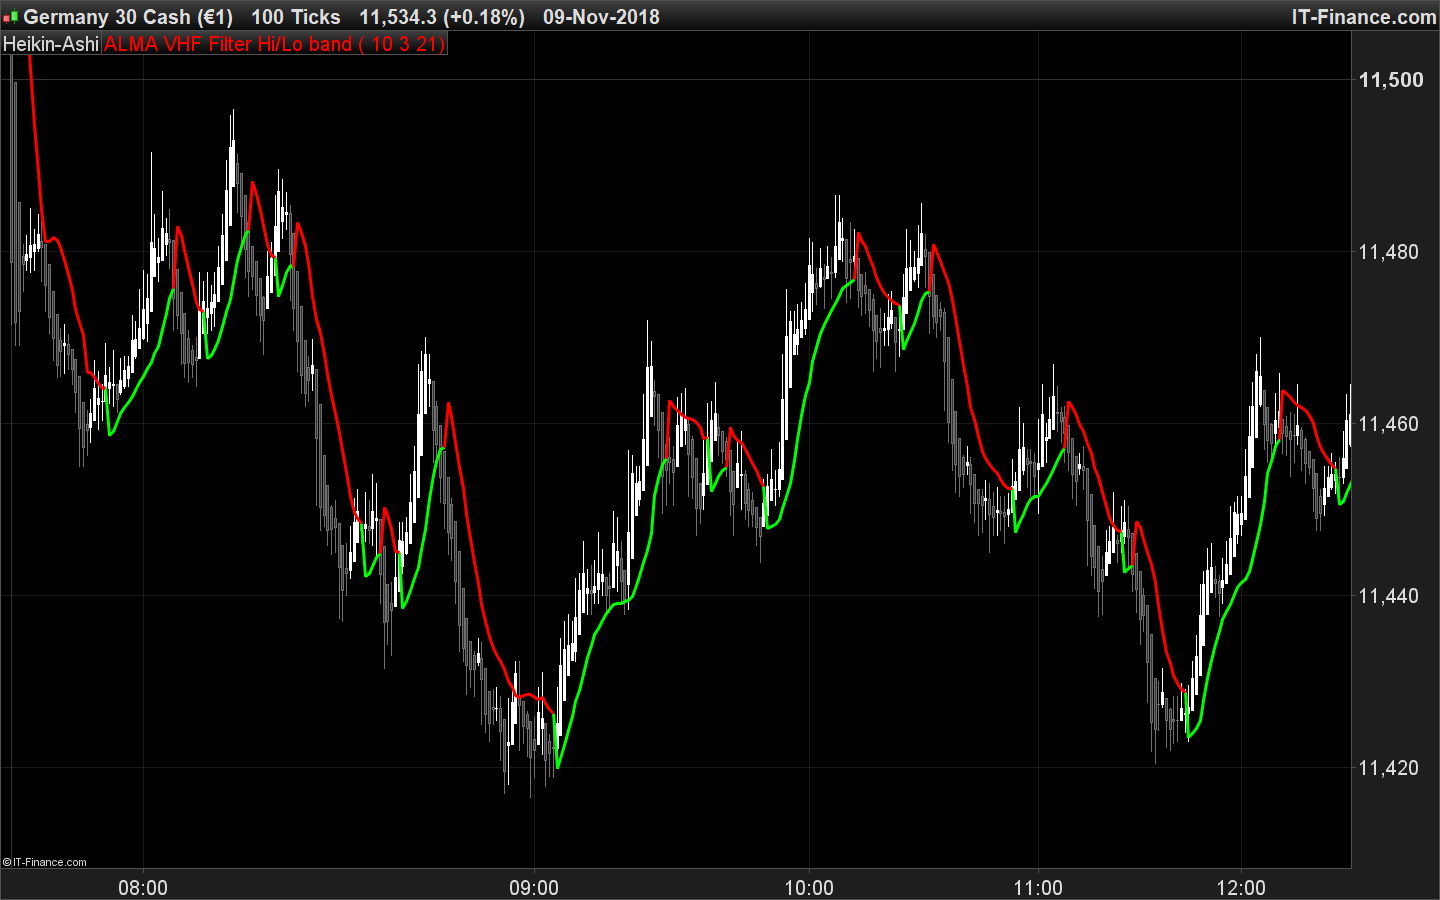
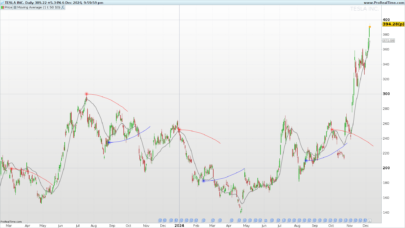
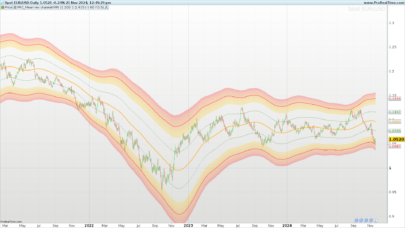
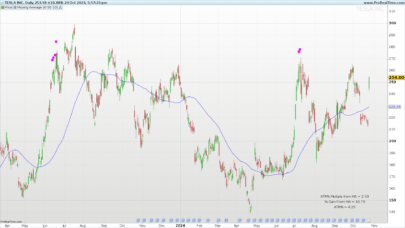
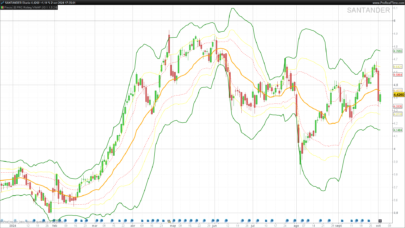
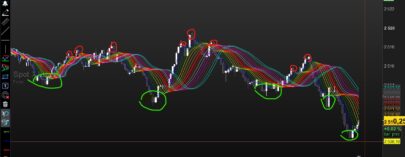
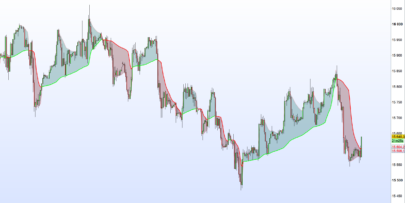
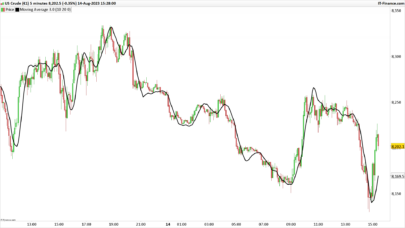
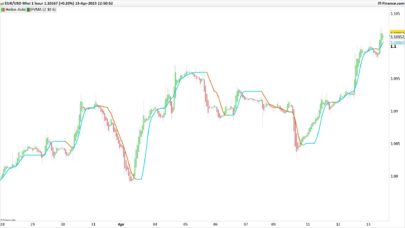
2 indicators in this post, the ALMA moving average with its offset automatically adjusted with a VHF (Vertical Horizontal Filter). The second one is a signals band made of 2 moving average calculated separately with Highs and Lows of the last X periods (Window setting).
I made it first as a rough idea and found it interesting for scalping trading as it reacts quickly enough to find good entries of potential new movement (and quickly revert on false signals), and automatically adapt the band due to volatility while in good trend, resulting of a “keep on trading” technique.
The VHFp controls the period of the VHF filter.
|
1 2 3 4 5 6 7 8 9 10 11 12 13 14 15 16 17 18 19 20 21 22 23 24 25 26 27 28 29 30 31 32 33 34 35 36 37 38 39 40 41 42 43 44 45 46 47 48 49 50 |
//PRC_ALMA VHF filter | indicator //11.11.2018 //Nicolas @ www.prorealcode.com //Sharing ProRealTime knowledge // --- settings Window = 7 Sigma = 3 VHFp = 21 // --- end of settings Price = customClose //VHF Length=VHFp CloseDiff = 0 SumDiff = 0 Serie = Price For Counter = 0 to Length - 1 do CloseDiff = Abs(serie[Counter] - serie[Counter + 1]) SumDiff = SumDiff + CloseDiff next If SumDiff = 0 Then SumDiff = 1 endif VHF = (Highest[Length](serie) - Lowest[Length](serie)) / SumDiff // Offset = max(0.01,1- VHF) m = (Offset * (Window - 1)) s = Window/Sigma WtdSum = 0 CumWt = 0 for k = 0 to Window - 1 do Wtd = Exp(-((k-m)*(k-m))/(2*s*s)) WtdSum = WtdSum + Wtd * Price[Window - 1 - k] CumWt = CumWt + Wtd next ALAverage = WtdSum / CumWt RETURN ALAverage |
Hi/Lo bands made of this moving average:
|
1 2 3 4 5 6 7 8 9 10 11 12 13 14 15 16 17 18 19 20 21 22 23 24 25 26 27 28 29 30 31 32 33 |
//PRC_ALMA VHF Filter Hi/Lo band | indicator //11.11.2018 //Nicolas @ www.prorealcode.com //Sharing ProRealTime knowledge // --- settings Window = 10 Sigma = 3 VHFp = 21 // --- end of settings hh = CALL "PRC_ALMA VHF filter"[window, sigma, VHFp](high) ll = CALL "PRC_ALMA VHF filter"[window, sigma, VHFp](low) if hh<hh[1] and low<ll then trend=-1 elsif ll>ll[1] and high>hh then trend=1 endif if trend=1 then iline=ll r=0 g=255 b=0 else iline=hh r=255 g=0 b=0 endif return iline coloured(r,g,b) style(line,3) as "ALMA VHF Filter Hi/Lo band" |
Share this
No information on this site is investment advice or a solicitation to buy or sell any financial instrument. Past performance is not indicative of future results. Trading may expose you to risk of loss greater than your deposits and is only suitable for experienced investors who have sufficient financial means to bear such risk.
ProRealTime ITF files and other attachments :PRC is also on YouTube, subscribe to our channel for exclusive content and tutorials






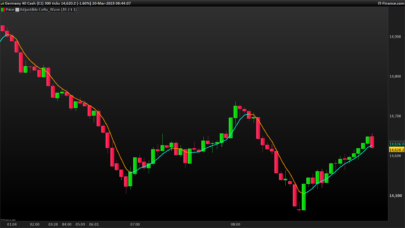
A very good combination Nicolas, thanks!
Hi Nicolas, I see two itf files; we should put both on them on the graph? thank you!
Only the second one if you want to have the same indicator as the one presented in the picture.
Thanks Nicolas!
Dear Nicolas, as usual big thank you for sharing those gems!
I imported your code of Alma HiLo bands into PRT and it charts perfectly.
However, when I tried to build a system and backtest it, it charts the result automatically but the entry/exit signals are mished mashed, at the wrong place – very strange.
My opinion is that it might be due to the “CALL” routines you used in the code.
I tried to fix this but unlucky so far.
Do you think this can be fixed?
Here is your code, with the trade signals (long and exit only for simplicity):
defparam cumulateorders=false
//PRC_ALMA VHF Filter Hi/Lo band | indicator
//11.11.2018
//Nicolas @ http://www.prorealcode.com
//Sharing ProRealTime knowledge
Window = 7
Sigma = 3
VHFp = 21
// — end of settings
HH = CALL “PRC_ALMA VHF filter”[window, sigma, VHFp](high)
LL = CALL “PRC_ALMA VHF filter”[window, sigma, VHFp](low)
if hh<hh[1] and lowLL[1] and high>hh then
trend=1
endif
if trend=1 then
iline=LL
else
iline=HH
endif
if not longonmarket and close[1] crosses over iline[1] and Close>High[1] then
buy at market
endif
if longonmarket and close < iline then
sell at market
You should not use offset in this case. Delete all the [1] references in your code. BTW, trend of the indicator doesn’t change when price go through the line, so in order to launch orders according to the indicator, you should use the “trend” variable and its change between 2 candlesticks.
That works now, thank you !
Hello Nicolas, the Indi is really great. Unfortunately, I get an error message that takes a long time to calculate, up to 2 seconds. Have it tried with defparam calculateonlastbars unfortunately without success, Maybe you have another solution. Thank you.
Yes, that’s how it goes when using loops..
Hi, Could I please have help with adding these indicators ‘on price’? Every indicator that I add plots as a sub-graph. What am I doing wrong here?
Just add it on price by clicking the wrench on the left upper side of the price chart.