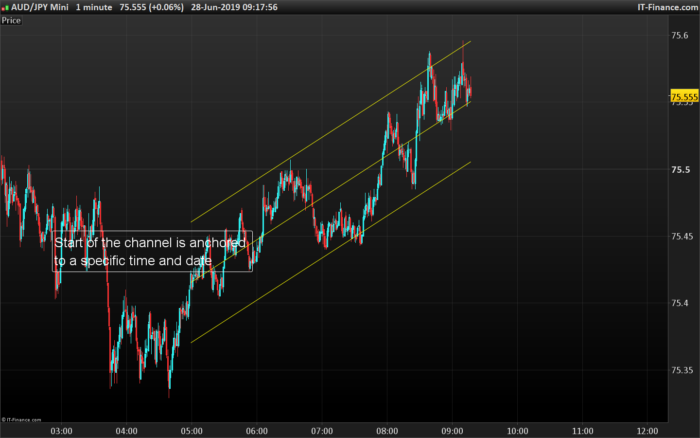
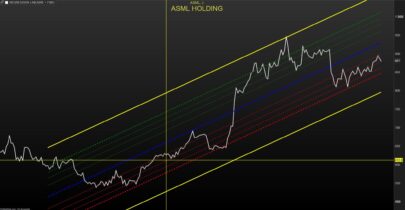
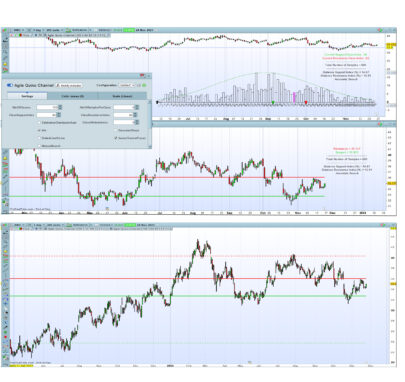
This version of the Linear Regression Channel with Standard Deviation (STD) and Standard Error (STE) bands has dynamic lookback for its calculation.
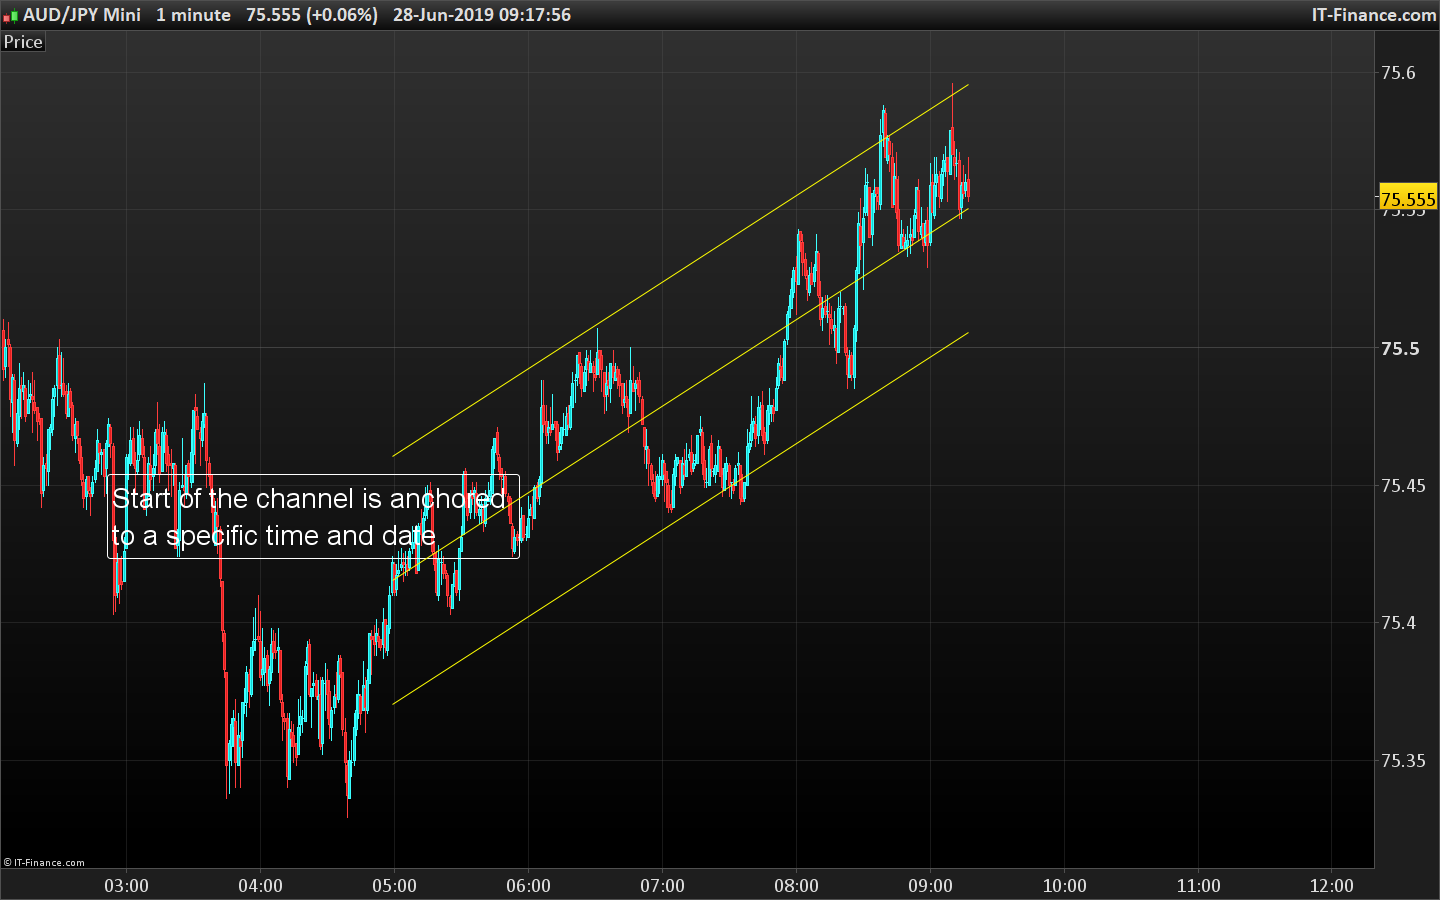
You can define in the setting a precise date and time to anchor the start of the channel, so its length evolves as time passing by. It can be useful to spot potential breakout of a defined trend or rebound on the top and bottom of the channel.
The original version with fixed bars lookback can be found here: Standard Deviation & Standard Error Linear Regression Channel
|
1 2 3 4 5 6 7 8 9 10 11 12 13 14 15 16 17 18 19 20 21 22 23 24 25 26 27 28 29 30 31 32 33 34 35 36 37 38 39 40 41 42 43 44 45 46 47 48 49 50 51 52 53 54 55 56 57 58 59 60 61 62 |
//PRC_StdSte LinRegChannAnchored | indicator //Standard Deviation and Standard Error with date&time anchor //Linear Regression Channel //28.06.2019 //Nicolas @ www.prorealcode.com //Sharing ProRealTime knowledge defparam drawonlastbaronly=true defparam calculateonlastbars=1000 // --- settings AnchorDate = 20190628 //Date anchor YYYYMMDD format AnchorTime = 050000 //Time anchor HHMMSS format ChannelType = 1 //1= Standard Deviation ; 2= Standard Erro NbDeviation = 1 //Deviation multiplier colorRed = 255 colorGreen = 255 colorBlue = 0 // --- end of settings if date=anchordate and time=anchortime then startbar=barindex endif lookback = max(1,barindex-startbar) if lookback>0 and date>=AnchorDate then sumx = 0 sumy = 0 sumxy = 0 sumx2 = 0 for cmpt = lookback downto 0 do tmpx = cmpt tmpy = close[cmpt] sumy = sumy+tmpy sumx = sumx+tmpx sumx2 = sumx2 + (tmpx*tmpx) sumxy = sumxy + (tmpy*tmpx) next n = lookback+1 if (sumx2 = sumx * sumx) then // protection to avoid infinite values b = sumxy - sumx * sumy else b = (n * sumxy - sumx * sumy) / (n * sumx2 - sumx * sumx) endif a = (sumy - b * sumx) / n drawsegment(barindex[lookback],a+b*lookback,barindex,a+b*0) coloured(colorRed,colorGreen,colorBlue) //channel if ChannelType = 1 then //Standard Deviation dat = std[lookback]*NbDeviation else dat = ste[lookback]*NbDeviation endif drawsegment(barindex[lookback],(a+b*lookback)+dat,barindex,a+b*0+dat) coloured(colorRed,colorGreen,colorBlue) drawsegment(barindex[lookback],(a+b*lookback)-dat,barindex,a+b*0-dat) coloured(colorRed,colorGreen,colorBlue) endif return |
Share this
No information on this site is investment advice or a solicitation to buy or sell any financial instrument. Past performance is not indicative of future results. Trading may expose you to risk of loss greater than your deposits and is only suitable for experienced investors who have sufficient financial means to bear such risk.
ProRealTime ITF files and other attachments :PRC is also on YouTube, subscribe to our channel for exclusive content and tutorials









Excellent Nicolas 😉
Hi Nicolas,
There seems to be a small error in the code, which causes the channel not to be shown.
Line 20 should read as follows: if date = anchordate and time >= anchortime then
Note the condition : >= anchortime
Regards,
violet
Hmm, I don’t think so, otherwise the channel will have a moving start and not anchored anymore.
If the channel doesn’t show, it may because the starttime is not met in the timeframe you are using.
Nicolas, can you share with me how PRT calculates LinearRegression ? Is it (3 * WeightedAverage Close X – 2 * AVERAGE Close X) X= Period?
The above code is the way it is calculated in PRT. However the exact indicator can be found here: https://www.prorealcode.com/prorealtime-indicators/standard-deviation-standard-error-linear-regression-channel/
Thanks Nicolas.
On my charts, the indicator doesnt go on the upper pannel, on prices, but under like an oscillator… What should I do to get it on prices
apply in on the chart, look at this how-to video: https://www.prorealcode.com/blog/video-tutorials/how-to-add-an-indicator-on-price-prorealtime/
interesting code thanks!