Andrew Abraham Trend Trader

Andrew Abraham Trend Trader

Copyright by HPotter v1.0 21/08/2014
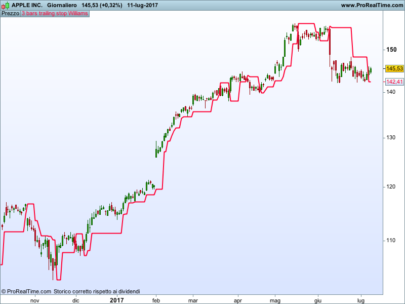
This is plots the indicator developed by Andrew Abraham in the Trading the Trend article of TASC September 1998.  

New traders quickly become familar with two adages: “The trend is your friend,” and “Let your profits run and cut your losses.” Many of us, however, have learned the hard way that these things are easier said than done. Why is that? One reason is lack of recognition, since the trend itself is rarely clarified and defined, let alone where it starts and ends. So we need a clear explication of what a trend is as well as where its beginning and its end are.
 Simply, if the trend is considered up, then the trend of prices are composed of upwaves and the downwaves are countertrend movements. Downward trends are the opposite, seen as downwaves with countertrend upwaves. Using several tools and functions, we can design a quantifiable approach to defining these waves. My favorite is the volatility indicator, which is a formula that measures the market volatility by plotting a smoothed average of the true range. The true range indicator originates from the work of J. Welles Wilder Jr. from his New Concepts in Technical Trading Systems. The definition of the true range is defined as the largest of the following:

  • The difference between today’s high and today’s low
  • The difference between today’s high and yesterday’s close, or
  • The difference between today’s low and yesterday’s close.

The calculation uses a 21-period weighted average of the true range, giving higher weight to the true range of the most recent bar. The final value is then multiplied by 3.

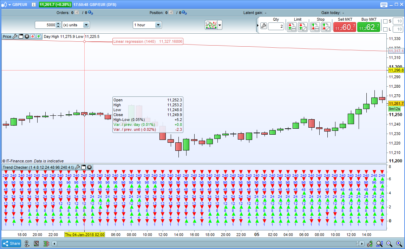
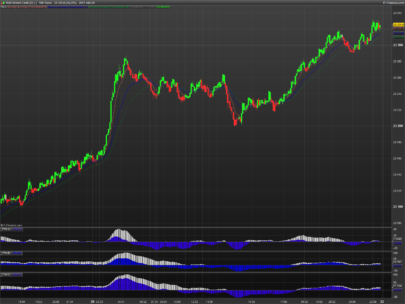
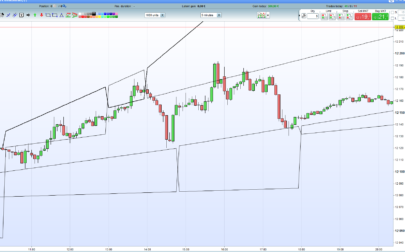
The volatility indicator is used as a stop-and-reverse method. Let’s say the market has been rising, then the volatility indicator is calculated each day and subtracted from the highest close during the rising market. The highest close is always used, even if there has been a series of lower closes since the highest close. If the market closes below the volatility indicator, then for the next day, the current reading of the volatility indicator is added to the lowest close. This step is followed each day until the market closes above the trailing volatility indicator.

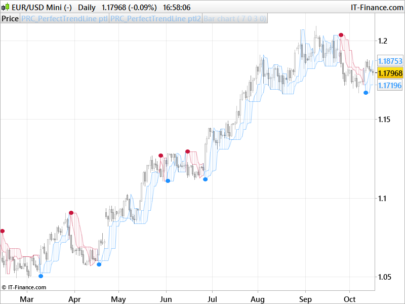
We now have a definition of the trend. An upward trend exists as long as the volatility indicator is below the market and a downtrend is in force if the volatility indicator is above the market.


Share this

Risk disclosure:

No information on this site is investment advice or a solicitation to buy or sell any financial instrument. Past performance is not indicative of future results. Trading may expose you to risk of loss greater than your deposits and is only suitable for experienced investors who have sufficient financial means to bear such risk.

ProRealTime ITF files and other attachments : How to import ITF files into ProRealTime platform?

PRC is also on YouTube, subscribe to our channel for exclusive content and tutorials

  1. Tradesun • 10/11/2015 #

    Salve, ho provato ad inserire l’indicatore nella piattaforma ma mi chiede di definire la variabile LENGTH e la variabile MULTIPLIER
    Vorrei chiedere se qualcuno può aiutarmi ad inserire correttamente questo indicatore.
    Grazie.

  2. maximus78 • 10/11/2015 #

    Tradesun, se scarichi il file ITF allegato e lo importi nella piattaforma ci sono già le variabili LENGHT e MULTIPLIER da settare a tuo piacimento.

avatar
Register or

Likes

avatar avatar avatar avatar avatar avatar avatar avatar avatar avatar avatar avatar avatar
Related users ' posts
DarioMazza Hi Vonasi, i have a question for you, the comand "pricetype" where did you found it in the ...
Vonasi PriceType is just a variable that I use. The value decides what type of price is used in the...
Vonasi I noticed a couple of typo errors in the code. The list of variables lines 4 to 11 should be...
Nicolas
7 years ago
Trinity Impulse
Trinity Impulse
5
Indicators
ribou ah d'accord merci beaucoup
domenico nlevel1 non modifica la curva al variare del suo valore
tiger_man_no1 Very nice ; what is the best period input date for DAILY CHART ?
Nicolas
7 years ago
Genotik Merci !
WarningTrading Comment peut on la comparer ? comme ceci ? cela ne me donne plus le message d'erreur manque...
sally31120 Bonjour, je n'arrive pas à créer ce screener close > supertrend extended2[1] la réponse...
Nicolas voir ce sujet pour un screener basé sur Supertrend Extended: https://www.prorealcode.com/top...
Marcel For those who are interested, I post trade opportunities with this indicator on Twitter. (@M...
swapping Thank you for sharing, best regards
Tellie2015 tack ska du ha för dina delningar både här o twitter
Leo Hi all, I posted a new version of this indicator ( I just add arrows to spot the local maxi...
Trading_En_El_Ibex35 Muchas Gracias por compartir este interesante indicador. Un saludo
xavieralava hola gracias leo
Nicolas
7 years ago
Nicolas https://www.prorealcode.com/topic/ayuda-screener-indicador-perfect-trend-line/#post-51291
Manu L. Bonjour Nicolas, suite a une de mes precedentes demande dans le forum indicateur, j'ai touv...
AntoGH C'est selon moi le meilleur indicateur, que j'ai vu, si vous trouvez mieux dîtes moi car dif...
Jiacky mma = average[per,1](close) should be mma = average[per,1](close * 1000). Otherwise TDF will...
bolsatrilera Hi Nicolas, I have this version of the True Balance Power ,created by eykpunter on Tradingvi...
bolsatrilera and the code : REM TRUE BALANCE OF POWER // código original de eykpunter para la plataform...
Steven Bahia Hi Nicolas - great indicator - is there a way to place a alert when the Oscillator crosses ...
Nicolas Alerts can't be programmed, you have to set them yourself with the Alert tool of the platfor...
Steven Bahia just to add to this would there be a way to establish a entry price from the Oscillator
juanj And the point of violation is the close of the candle that violates the line by generating a...
juanj For the latest version of the strategy or to follow updates and developments see the thread ...
phanz i backtested it with 10K units of EURUSD 1 hour i get an equity curve that is going one way ...
Wing Not yet but I plan to.
Leo Have a look in this Forum, I got something interesting for you... https://www.prorealcode.co...
Dávid Gyalus Dear Wing, As I am a daytrader, and one of my best friend is a programmer we think your a...
EchnatonX Hallo Im Demomodus bei IG habe ich das Problem, dass oft keine Orders ausgeführt werden kön...
Jan EchnatonX, nice late answer of me: Make the stop loss a percentage of the close, like 100/...
guleny Hello I made some optimization to make it better. But there are 5 transacttion which incr...
stratobast Good afternoon everyone. Thanks Doctrading for your work. I have an issue while using this ...
stratobast My bad guys. I understood what was the problem. The indicator uses highs and lows for the Re...
samwarduk Has anyone tried this on Bitcoin GBP1? The results look amazing but every time mine trie...
Kris75 Hi Bolsatrilera, I love this indicator! Thanks; => did you develop a strategy around...
Doctrading AH ok, I think the ca3 is the same : ca3 = pB[1] < 0.2 and pB < 0.2 Best regards,
chromosome21 Hello everybody, First, thank you so much for all your advices, I'm a begginer in trading a...
bertrandpinoy bonjour j ai un probleme avec ce code modifié, apparement PRT ne veut pas...avez vous une so...
rispardin no entiendo como funciana este indicador, por favor alguien podria explicar como utilizarlo???
AVT No se trata de un solo indicador, pero cada linea muestra otra información, de abajo hacia ...
IV Mcm Your indicator is interesting, I evaluated its relevance with the squeeze to detect the phas...
Kris75 Hi Gabri I launched a very simple strategy based on the 3 bars trailing stop that you cre...
TimDeCat Hi. Has anyone coded a version that you could alter it to say 5 bar trailing stop? ie make ...
Nicolas Please open a new topic in forums so we can code it there, thanks.

Top