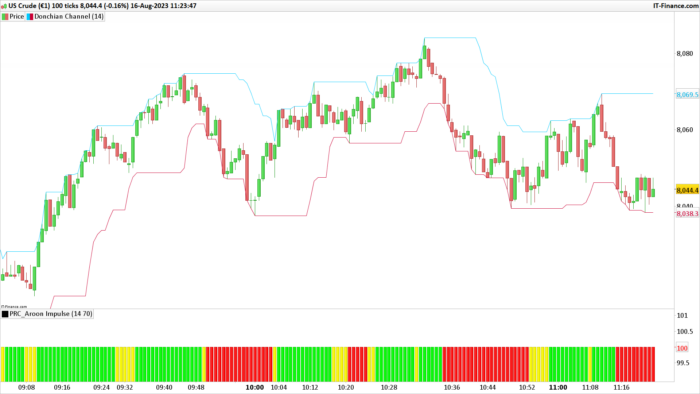
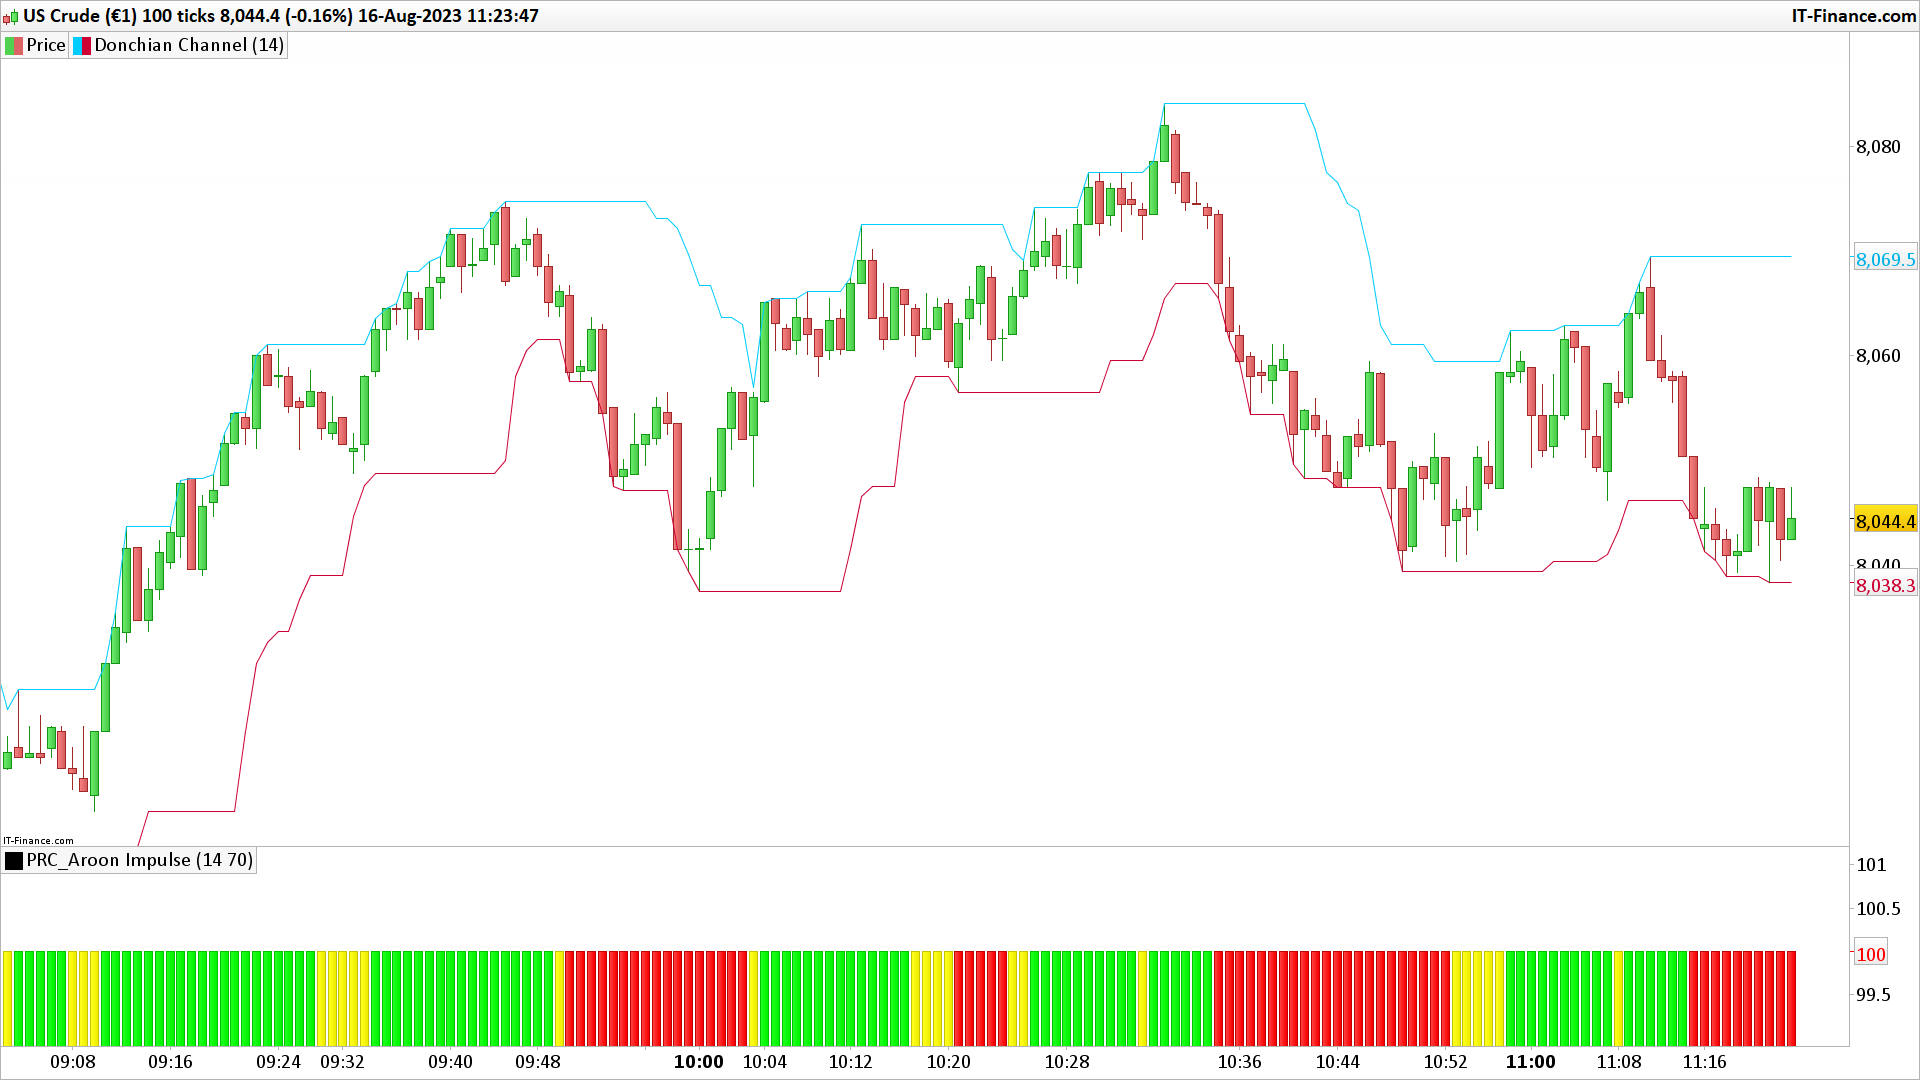
This code is designed to visually represent the “Aroon” indicator, a popular tool in financial trading. The Aroon indicator helps determine the strength and direction of a trend in the market.
Here’s what the code does step by step:
- Aroon Values:
–up = AroonUp[period]: This gets the value of the “Aroon Up” for a specified period.
–dn = AroonDown[period]: Similarly, this gets the value of the “Aroon Down” for the same period. These two values show how long it’s been since the highest high (for “Aroon Up”) and the lowest low (for “Aroon Down”) were last seen within that period. - Setting Default Colors
r=255andg=255: Sets up default red (r) and green (g) values to a maximum (255 is the max value in RGB color code). This combination results in a yellow color. - Checking Aroon Values and Adjusting Colors: – If the “Aroon Up” value is greater than the “Aroon Down” value and surpasses a certain level (determined by
leveltrigger), the color is set to green (r=0andg=255). – If the “Aroon Down” value is greater than the “Aroon Up” value and it exceeds theleveltrigger, the color is set to red (r=255andg=0). - Output: return 100 coloured(r,g,0) style(histogram)`: This is displaying a histogram (like a bar chart) with a height of 100 units, and the color of the histogram bar will be either green or red based on the conditions above. The height value “100” here is arbitrary and is likely for visualization consistency.
In simpler terms: The code checks the strength and direction of the market trend using the Aroon values. If the market trend is going upwards and is strong, it displays a green bar. If it’s heading downwards and is strong, it displays a red bar. If neither condition is met, it might display a yellow bar, depending on how the rest of the code is structured.
|
1 2 3 4 5 6 7 8 9 10 11 12 13 14 15 16 17 18 19 20 21 22 23 24 |
//PRC_Aroon Impulse | indicator //16.08.23 //Nicolas @ www.prorealcode.com //Sharing ProRealTime knowledge Period = 14 LevelTrigger = 70 up=AroonUp[period] dn=AroonDown[period] r=255 g=255 if up>dn and up>=leveltrigger then r=0 g=255 endif if up<dn and dn>=leveltrigger then r=255 g=0 endif return 100 coloured(r,g,0) style(histogram) |
Share this
No information on this site is investment advice or a solicitation to buy or sell any financial instrument. Past performance is not indicative of future results. Trading may expose you to risk of loss greater than your deposits and is only suitable for experienced investors who have sufficient financial means to bear such risk.
ProRealTime ITF files and other attachments :PRC is also on YouTube, subscribe to our channel for exclusive content and tutorials




Hello Nicolas,
This indicator repainting ?
It’s impossible for it to repaint the values of the past.
@Nicolas
Hello,
quel serait le screener lorsque l’histogramme passe du jaune au vert car impossible de le créer via l’aide à la programmation ?
Merci