







ATR adaptive EMA
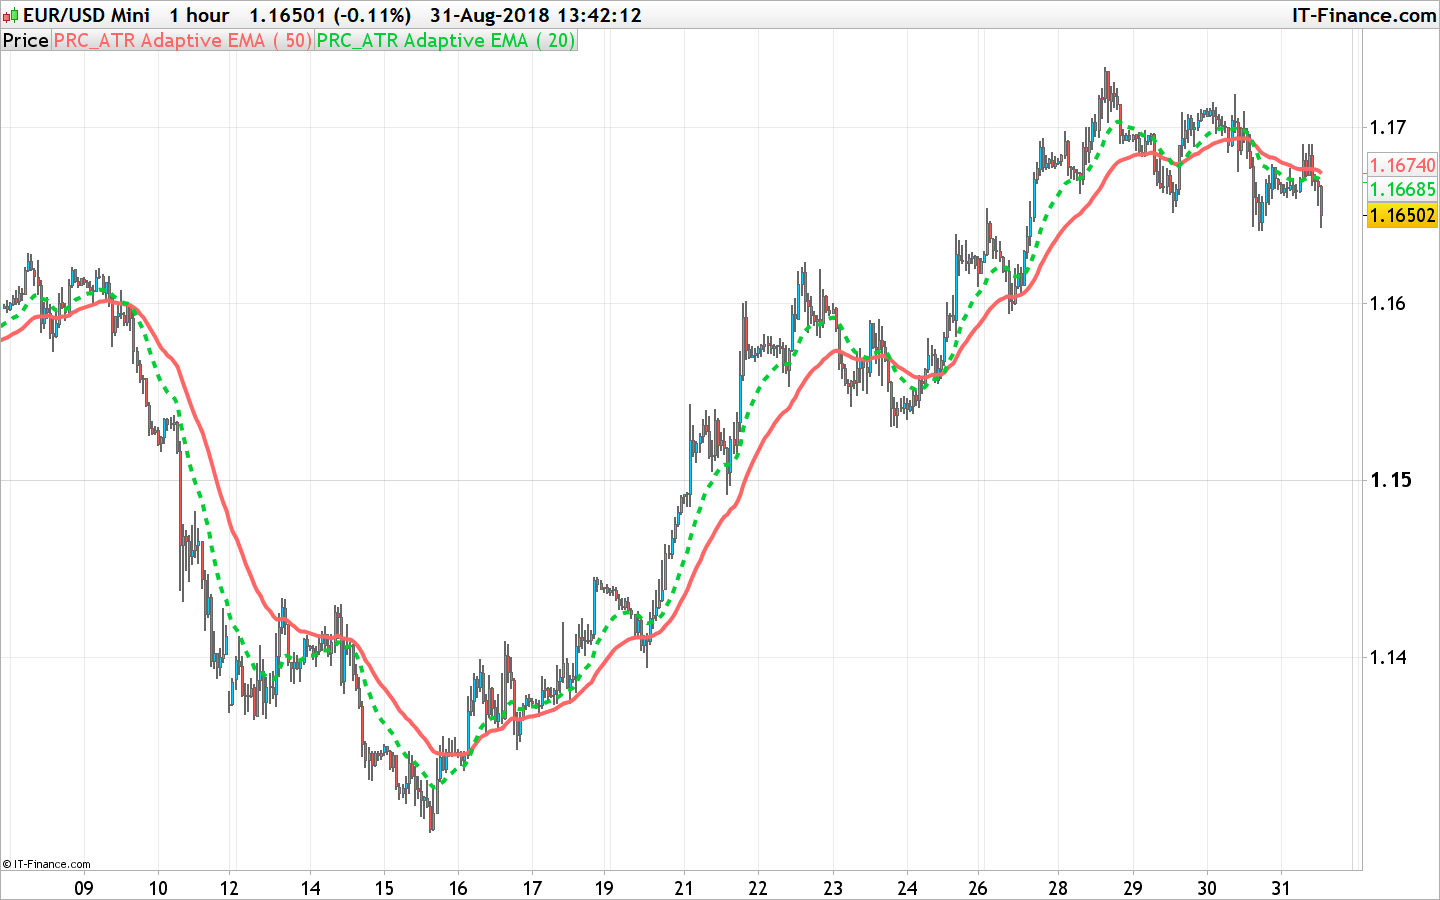
There a lot of ways how some indicators can be made adaptive instead of calculating fixed periods.
One, less known method, is to use normalized ATR (Average True Range) for making the calculation adaptive. And since EMA (Exponential Moving Average) is a a good candidate for being adaptive (it allows fractional periods for calculation), this EMA is using ATR for adaptive EMA calculations.
(author: mladen)
//PRC_ATR Adaptive EMA  | indicator
//31.08.2018
//Nicolas @ www.prorealcode.com
//Sharing ProRealTime knowledge
//converted from Metatrader5 version

// --- settings
EmaPeriod = 20
// --- end of settings

if barindex>EmaPeriod then
 price = customclose
 atr = averagetruerange[EmaPeriod]
 start = max(1,barindex-EmaPeriod+1)
 mmax = highest[start](atr)
 mmin = lowest[start](atr)
 coeff = 1-(atr-mmin)/(mmax-mmin)
 alpha = 2.0 / (1+EmaPeriod*(coeff+1.0)/2.0)
 val  = val[1]+alpha*(price-val[1])
endif

return val
Comments
You must be logged in to post a comment.


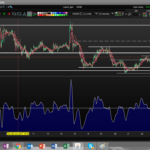
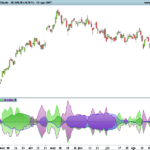
Hi Nicolas, when i upload this indicator in my list and use it as indicator. I get a totally different picture in my screen than what is presented here.. I cant sent you a pictre of it, but onder the graph there opens a second box, and a swirling line in it with shadow blue colours. What do i wrong?
Buenos dias Nicolas, al agregar tu indicador no me reconoce la variable Price ni en la linea 12 ni en la 19, prorealtime al agregar el indicador me da un mensaje indicandome: "Uno de los siguientes caracteres seria mas adecuado que "PRICE: ENDIF"" No ve el error en el codigo que has creado, podrias ayudarme?