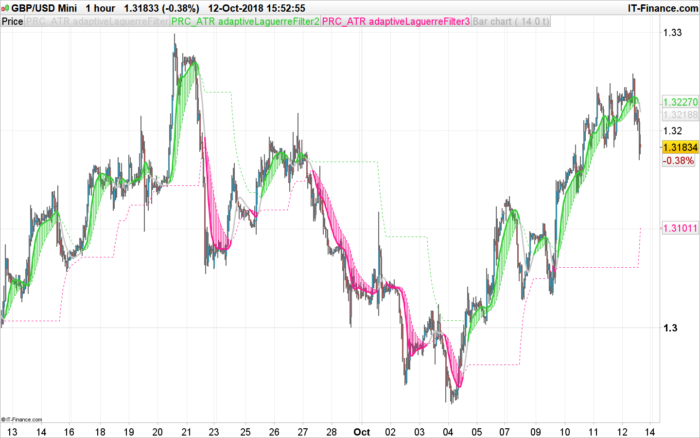
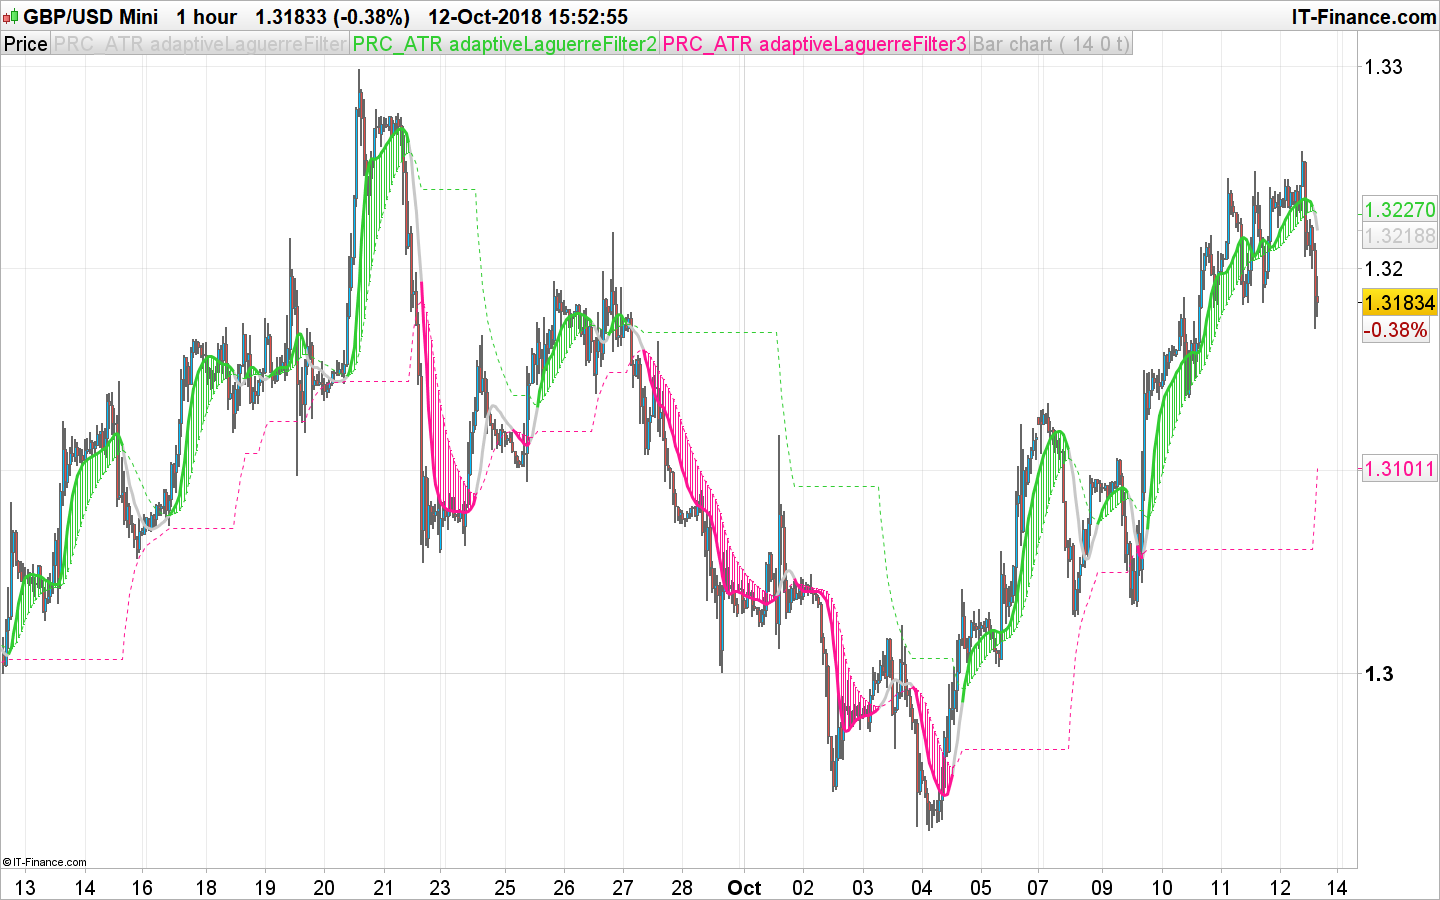
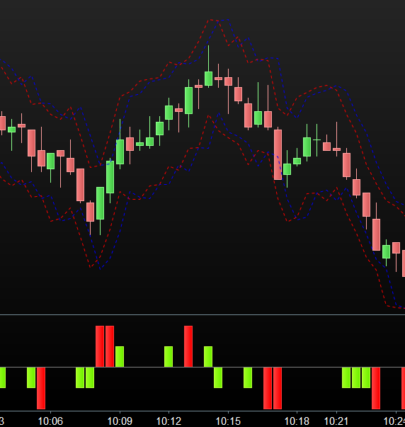
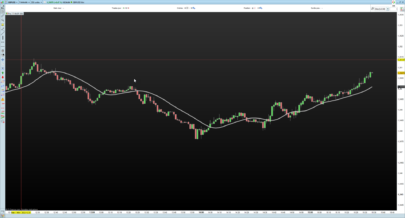
This version of the Laguerre filter on price uses dynamic Gamma calculation based on recent ATR, making it more adaptive and versatile to the recent market movement.
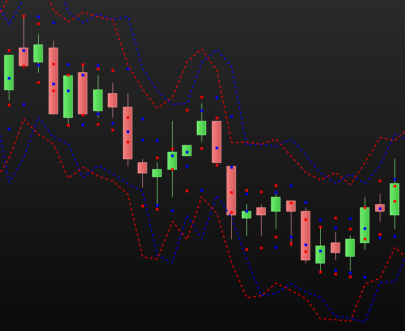
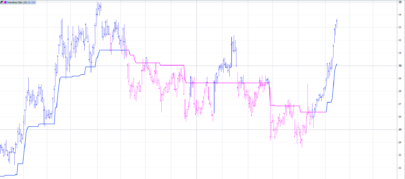
The indicator has also a dynamic channel made of self adjusting levels that act as signals filtering.
You have the ability to change the period used for the levels with the “inpPeriod1” setting, if it is set to 0, the period is the same as the one used for the ATR.
You can add or remove the filling color added between the Laguerre curve and the channel with the “ColorFill” setting.
|
1 2 3 4 5 6 7 8 9 10 11 12 13 14 15 16 17 18 19 20 21 22 23 24 25 26 27 28 29 30 31 32 33 34 35 36 37 38 39 40 41 42 43 44 45 46 47 48 49 50 51 52 53 54 55 56 57 58 59 60 61 62 63 64 65 66 67 68 69 70 71 72 73 74 75 76 77 78 79 80 |
//PRC_ATR adaptiveLaguerreFilter | indicator //12.10.2018 //Nicolas @ www.prorealcode.com //Sharing ProRealTime knowledge //converted from MT5 version // --- settings inpPeriod = 14 // Period inpPeriod1 = 0 // Levels period (<=1 for same as filter period) ColorFill = 1 // 1=true ; 0=false // --- end of settings Series = customclose atrperiod = max(1,inpPeriod) atr= averagetruerange[atrperiod] mmax = highest[atrPeriod](atr) mmin = lowest[atrPeriod](atr) if mmin<>mmax then coeff=1-(atr-mmin)/(mmax-mmin) else coeff=0.5 endif coeff = (coeff+1.0)/2.0 period = inpPeriod*coeff gamma = 1.0 - 10.0/(period+9.0) once l0 = Series once l1 = Series once l2 = Series once l3 = Series IF BarIndex < max(inpPeriod,inpPeriod1) THEN laguerre = Series ELSE l0 = (1 - gamma) * Series + gamma * l0[1] l1 = -gamma * l0 + l0[1] + gamma * l1[1] l2 = -gamma * l1 + l1[1] + gamma * l2[1] l3 = -gamma * l2 + l2[1] + gamma * l3[1] laguerre = (l0 + 2 * l1 + 2 * l2 + l3) / 6 val=laguerre lvlPeriod=inpPeriod if inpPeriod1>0 then lvlPeriod=inpperiod1 endif alpha = 2.0/(1.0+lvlPeriod) if val>leveld then levelu = levelu[1]+alpha*(val-levelu[1]) endif if val<levelu then leveld = leveld[1]+alpha*(val-leveld[1]) endif //OB and OS colors r=200 g=200 b=200 if val>levelu then r=50 g=205 b=50 if colorfill then drawbarchart(val,levelu,val,levelu) coloured(r,g,b) endif elsif val<leveld then r=255 g=20 b=147 if colorfill then drawbarchart(val,leveld,val,leveld) coloured(r,g,b) endif endif ENDIF return val coloured(r,g,b) style(line,3), levelu coloured(50,205,50) style(dottedline), leveld coloured(255,20,147) style(dottedline) |
Share this
No information on this site is investment advice or a solicitation to buy or sell any financial instrument. Past performance is not indicative of future results. Trading may expose you to risk of loss greater than your deposits and is only suitable for experienced investors who have sufficient financial means to bear such risk.
ProRealTime ITF files and other attachments :PRC is also on YouTube, subscribe to our channel for exclusive content and tutorials





Hello Nicolas, is it possible to stablish a bullish screener for this indicator when the central filter (FILTER) is bigger than the upper filter (FILTER2) ?
I have tried this, but it does not work:
“PRC_ATR adaptiveLaguerreFilter”[14, 0, 1](close)
c1 = (indicator1 > indicator2)
indicator3, indicator4, ignored = CALL “PRC_ATR adaptiveLaguerreFilter”[14, 0, 1](close)
c2 = (indicator3[1] <= indicator4[1])
SCREENER[c1 AND c2] (Variation AS "% Var barra ant")
Please open a topic in the screener section to ask for this specific query.
Hello,
the indicator doesn’t show up anything on the screen, any suggestions please?