1. Introduction
In technical analysis, one of the main challenges is to identify moments when the price of an asset deviates significantly from its average behavior, which can generate trading opportunities. To achieve this, we combine the use of the Average True Range (ATR) and a moving average (MA) to create an indicator that allows us to measure market volatility and detect potential points of reversal.
The ATR is a classic tool used to measure the volatility of an asset, and the moving average is widely known for its ability to smooth price and show the general trend. This indicator, which we will call “ATR Multiple Detection from the Moving Average”, is based on calculating the percentage gain or loss from a moving average and comparing it to the ATR value, also expressed as a percentage. From this, we can identify when the price has reached a significant multiple of the ATR relative to the moving average.
This approach allows traders to identify moments when the price is far enough from the moving average to anticipate a trend change, making it very useful for those looking to trade during high volatility moments.
2. Indicator Fundamentals
This indicator is based on three key elements:
Moving Average (MA)
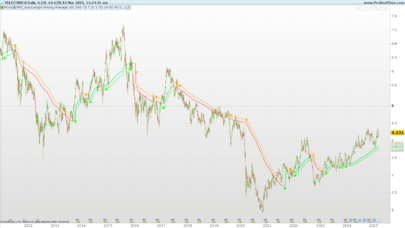
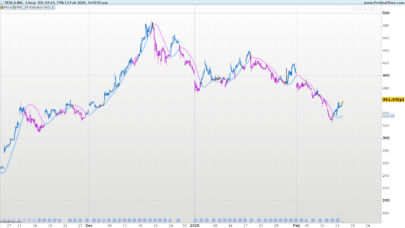
The moving average is one of the most commonly used indicators in technical analysis. It is calculated by averaging the closing prices of a specified number of bars. In this case, we use a configurable moving average that allows you to adjust the period length (by default, 50 periods) and the type of moving average, whether simple, exponential, or any other type the user prefers.
Average True Range (ATR)
The Average True Range (ATR) is an indicator that measures market volatility. It is calculated as the average of the true ranges over a specified number of periods. The ATR gives us insight into how volatile the price of an asset is, which is useful for anticipating sharp market movements.
Price-to-MA Relationship
The indicator also calculates the percentage gain or loss from the moving average, giving us an idea of how far the current price is from its average. This relationship is expressed as a percentage and is later compared to the ATR.
3. Detection of ATR Multiples from the MA
The detection of ATR multiples is the core of this indicator. Essentially, this indicator compares the percentage difference between the current price and the moving average with the ATR value, and determines how many times the ATR is contained in that difference. If this multiple exceeds a value defined by the user (default: 10 times), the indicator flags a key point on the chart.
The calculation steps are as follows:
- Calculate the % Gain from the Moving Average:
- The difference between the current price and the moving average is measured and expressed as a percentage. This tells us how much above or below the current price is relative to its moving average.
- Formula: gainFromMA=round((close/ma-1)*100,2)
- Calculate ATR as a Percentage of Price:
- The ATR is calculated as a percentage of the current price. This tells us how much the ATR represents in relation to the price.
- Formula: pctATR=round(atr/close*100,2)
- Ratio of Gain to ATR:
- Finally, the percentage gain relative to the moving average is compared to the ATR percentage to obtain a multiple. This multiple indicates how many times the ATR fits into the percentage difference between the price and the MA.
- Formula: atrMultFromMA=round(gainFromMA/pctATR,2)
When this multiple exceeds the defined value (by default, 10 times the ATR), the indicator marks a visual point on the chart, indicating that the price has reached a significant deviation level relative to its moving average.
4. Indicator Configuration
The indicator includes three adjustable parameters that the user can configure based on their trading preferences:
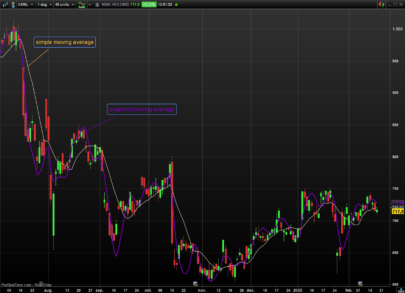
- matype (moving average type): This parameter allows you to choose the type of moving average to be used. The most common types are the simple moving average (SMA) and the exponential moving average (EMA), although ProRealTime offers several additional types.
- maLength (moving average length): This parameter defines the number of bars used to calculate the moving average. The larger this value, the smoother the moving average will be, as it will include more historical data.
- multipleAtr (ATR multiple): This parameter defines how many times the ATR value must exceed the ratio with the MA for a signal to be marked on the chart. A high value makes the indicator more sensitive to large price movements, while a lower value detects smaller movements.
These three parameters offer great flexibility to customize the indicator according to the user’s trading style, whether it’s a conservative or more aggressive approach.
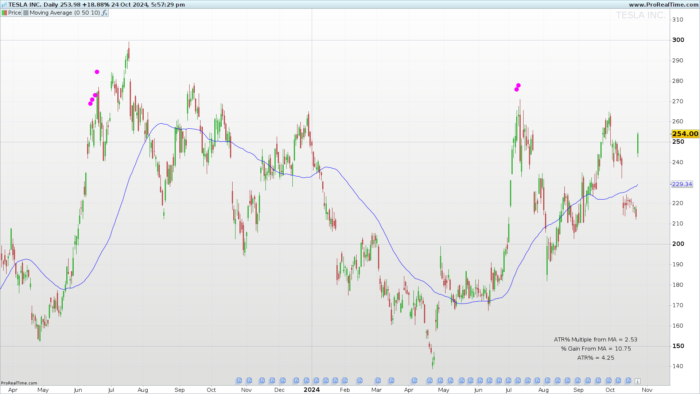
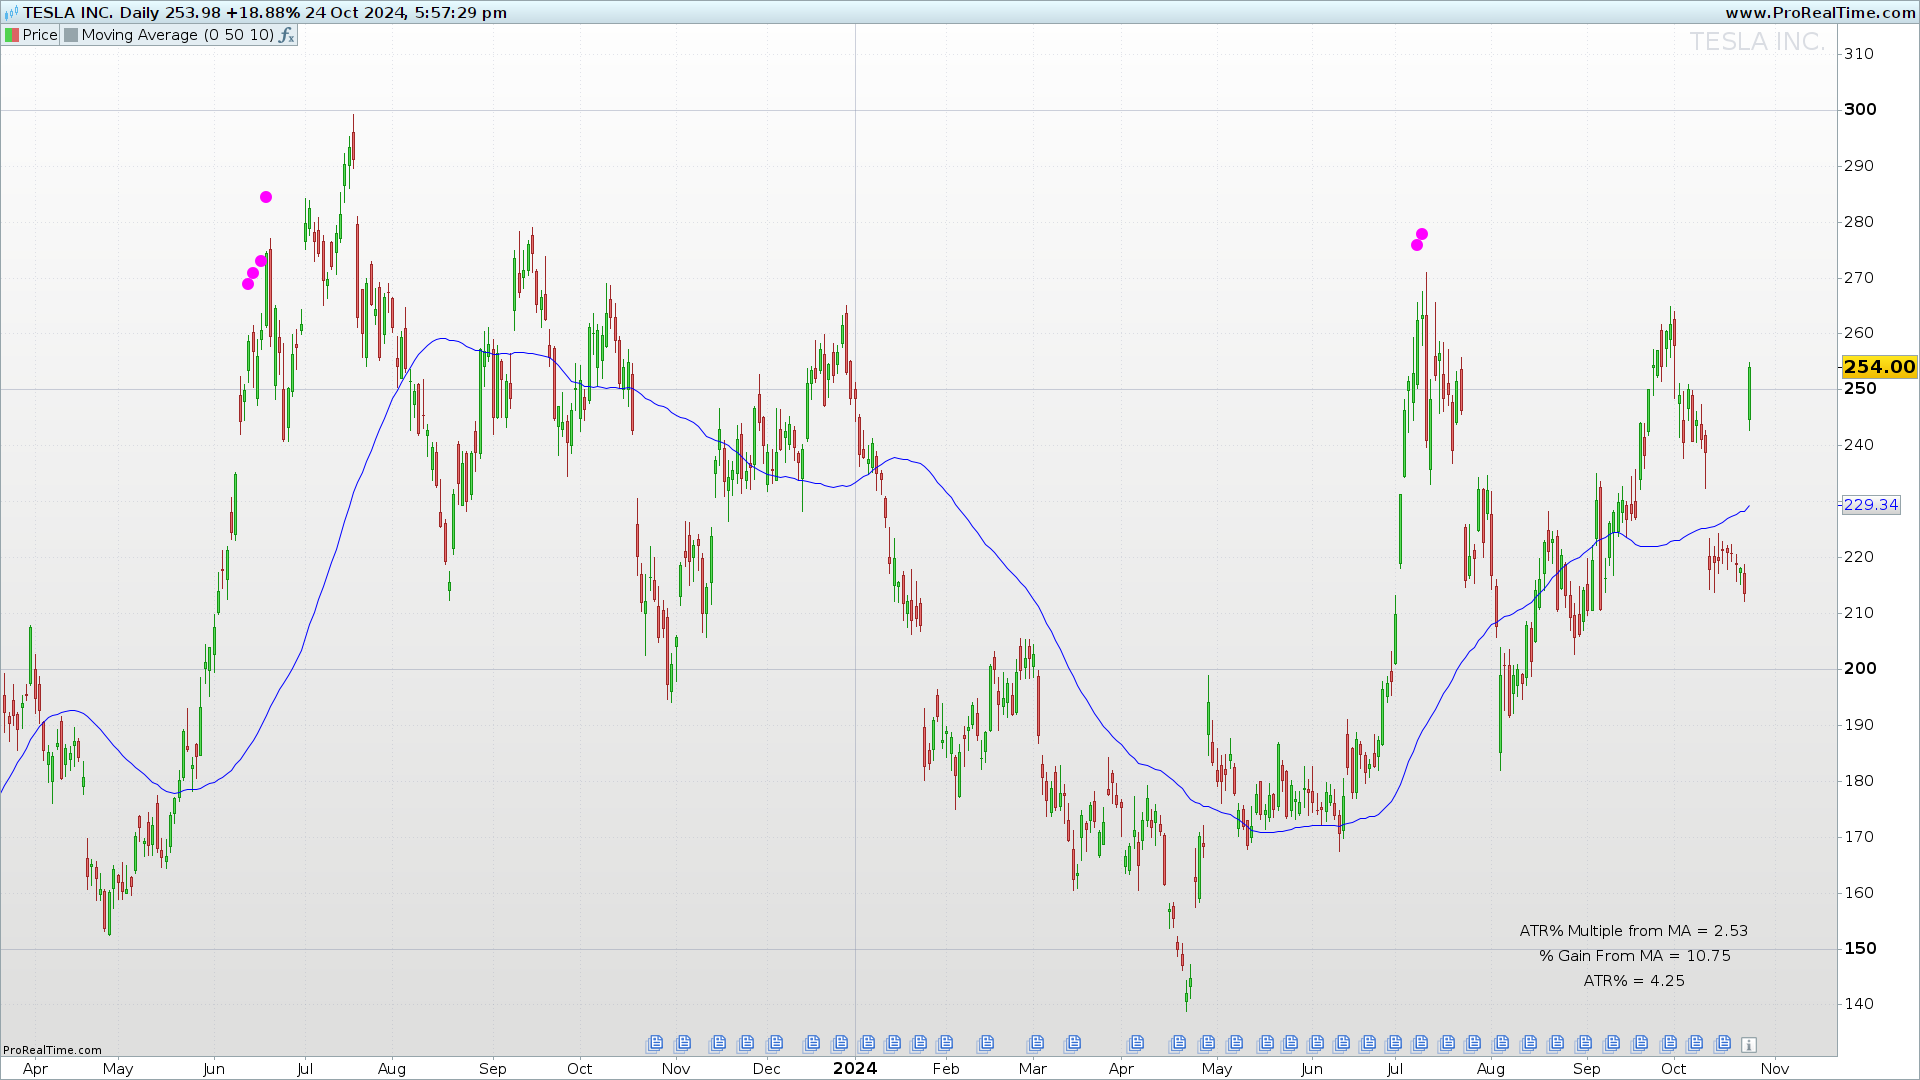
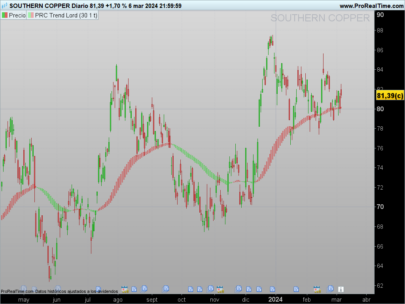
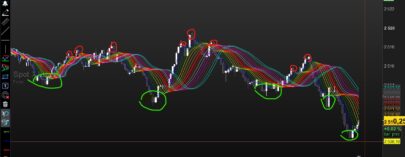
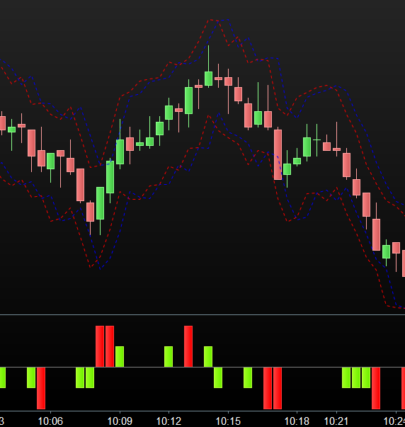
5. Chart Visualization
The indicator provides a clear and concise visualization of key points on the chart, making data interpretation easier.
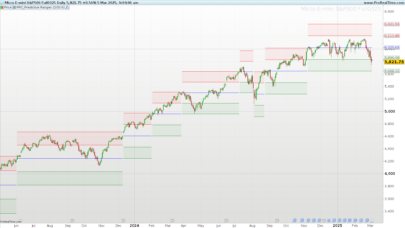
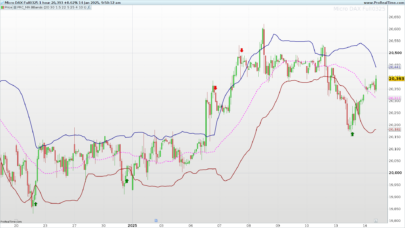
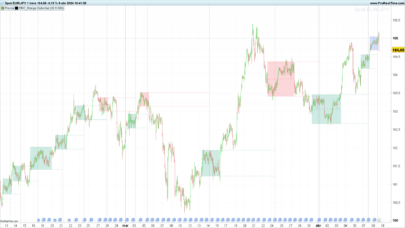
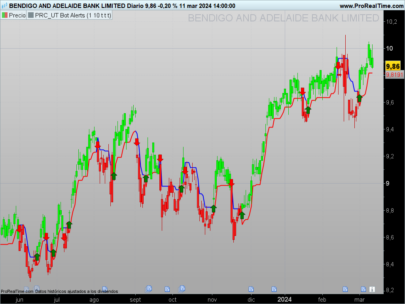
- Detection Points: When the ATR multiple exceeds the set value, the indicator plots a point on the chart at the top of the current bar. This point appears in “fuchsia” color to visually highlight the moment of interest.
- Informative Texts: In the lower-right corner of the chart, the indicator displays texts with detailed information about the current values:
- % Gain from MA.
- ATR in %.
- ATR Multiple from MA.
These texts allow the user to have a clear idea of how the key metrics are behaving in real-time, without the need for additional calculations.
6. Conclusion
The “ATR Multiple Detection from the Moving Average” indicator is a powerful tool for detecting moments of high volatility and potential reversal points in the markets. By combining the ATR with a moving average, traders can effectively identify when the price has deviated significantly from its average, which can signal a trading opportunity. Additionally, its customization capabilities through various parameters make it useful for a wide variety of trading styles, from scalping to swing trading.
This indicator is especially recommended for traders looking to take advantage of sharp market moves, where volatility plays a key role in identifying opportunities.
Share this
No information on this site is investment advice or a solicitation to buy or sell any financial instrument. Past performance is not indicative of future results. Trading may expose you to risk of loss greater than your deposits and is only suitable for experienced investors who have sufficient financial means to bear such risk.
ProRealTime ITF files and other attachments :
Find other exclusive trading pro-tools on ![]()
PRC is also on YouTube, subscribe to our channel for exclusive content and tutorials
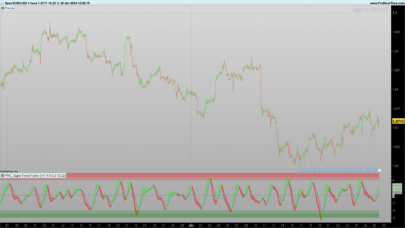
Muy bueno. ¿Podría hacerse para señalar extremos por el lado bajista? Lo mismo a la inversa. Las estrategias de reversión a la media son muy eficaces, gracias como siempre.
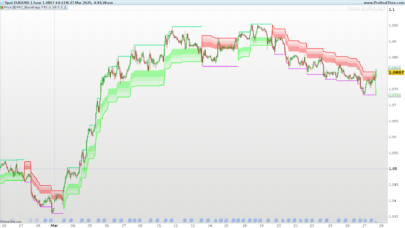
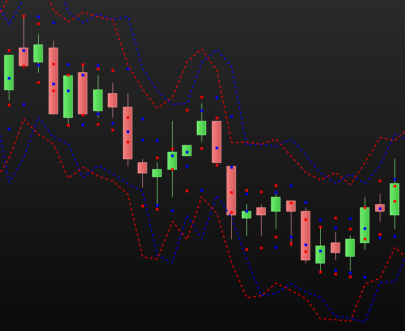
Esta es una versión del indicador, para ambos extremos.
//———————————————//
//PRC_ATR% multiple from MovingAverage
//version = 0
//24.10.2024
//Iván González @ http://www.prorealcode.com
//Sharing ProRealTime knowledge
//———————————————//
//—————Inputs————————//
//———————————————//
//matype=0
//maLength=50
//multipleAtr=10
//———————————————//
//————-Moving average——————//
//———————————————//
ma=average[maLength,matype](close)
//———————————————//
//————-Average True Range————–//
//———————————————//
atr=averagetruerange[14](close)
//———————————————//
//——-% Gain From Moving Average————//
//———————————————//
gainFromMA=round((close/ma-1)*100,2)
gainFromMAb=round((ma/close-1)*100,2)
//———————————————//
//——-% ATR———————————//
//———————————————//
pctATR=round(atr/close*100,2)
//———————————————//
//——ATR % Multiple from Moving Average—–//
//———————————————//
atrMultFromMA=round(gainFromMA/pctATR,2)
atrMultFromMAb=round(gainFromMAb/pctATR,2)
//———————————————//
//———–Multiple ATR Detection————//
//———————————————//
if atrMultFromMA>=multipleAtr then
drawpoint(barindex,high+atr,2)coloured(“fuchsia”)
endif
if atrMultFromMAb>=multipleAtr then
drawpoint(barindex,low-atr,2)coloured(“red”)
endif
//———————————————//
//————-Data last candle—————-//
//———————————————//
if islastbarupdate then
drawtext(“% Gain From MA = #gainFromMA#”,-200,100)anchor(bottomright,xshift,yshift)
drawtext(“ATR% = #pctATR#”,-200,75)anchor(bottomright,xshift,yshift)
drawtext(“ATR% Multiple from MA = #atrMultFromMA#”,-200,125)anchor(bottomright,xshift,yshift)
endif
return ma as “Moving Average” coloured(“blue”)
Muchas gracias ¡¡