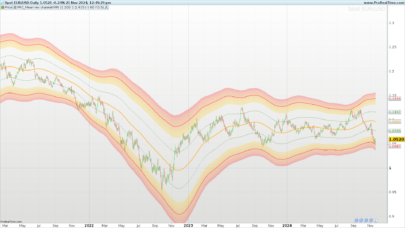
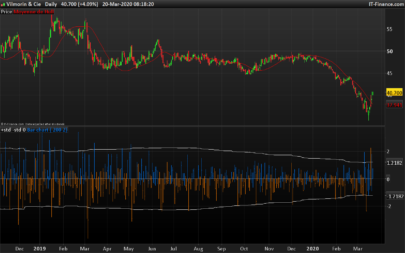
Please find attach below the average distribution indicator of price. It reflects the extreme values of closed price over the last N periods. I add lines treshold that act like frontiers to pretend price are in its extremum values, theses ones are calculated as average of the higher and lower deviation from the N mean.
Because price will always revert to its mean, we can take opposite (contrarian) trades when price crosses upper or lower treshold.
This indicator could even be use for scalping purpose in the same direction of the price when it reach the upper or lower lines.
Feel free to comments and modify this basic vision of mean reversion indicator.
|
1 2 3 4 5 6 7 8 9 10 11 12 13 14 15 16 17 18 19 20 21 22 23 24 25 26 27 28 29 30 31 32 33 34 35 36 37 38 39 40 41 42 43 |
// external parameters : // MAp = 30 // MaxBars = 500 // divisor = 6 MA = average(Close)[MAp] if(High>MA) THEN DevH = (1-(MA/High))*100 ENDIF if(Low<MA) THEN DevL = (1-(MA/Low))*100 ENDIF if(DevH>0) THEN SignalH=DevH ELSE SignalH=0 ENDIF if(DevL<0) THEN SignalL=DevL ELSE SignalL=0 ENDIF LastH = 0 LastL = 0 FOR i = 0 TO MaxBars DO if(DevH[i]>LastH AND DevH[i]<100) THEN LastH=DevH[i] ENDIF if(DevL[i]<LastL AND DevL[i]<100) THEN LastL=DevL[i] ENDIF NEXT deviation = (LastH+ABS(LastL))/divisor RETURN deviation COLOURED(255, 255, 0) As "Deviation H" , -deviation As "Deviation L", SignalH As "Signal H", SignalL As "Signal L" |
Share this
No information on this site is investment advice or a solicitation to buy or sell any financial instrument. Past performance is not indicative of future results. Trading may expose you to risk of loss greater than your deposits and is only suitable for experienced investors who have sufficient financial means to bear such risk.
ProRealTime ITF files and other attachments :PRC is also on YouTube, subscribe to our channel for exclusive content and tutorials


Merci Nicolas pour cet indicateur, il est très utile pour voir les vagues