The Average True Range Percent is the classical ATR indicator normalized to be bounded to oscillate between 0 and 100 percent of recent price variation. As is, it average true range of an instrument can be easily compared to any other because of absolute percentage variation and not prices itselves. Look at screenshot attached for comparaison between german DAX30 an SP500 on thirty minutes timeframe.
|
1 2 3 4 5 6 |
//parameters // p = 14 ATRP = (averagetruerange[p](close)/close)*100 RETURN ATRP as "Average True Range Percent" |
Share this
No information on this site is investment advice or a solicitation to buy or sell any financial instrument. Past performance is not indicative of future results. Trading may expose you to risk of loss greater than your deposits and is only suitable for experienced investors who have sufficient financial means to bear such risk.
ProRealTime ITF files and other attachments :PRC is also on YouTube, subscribe to our channel for exclusive content and tutorials



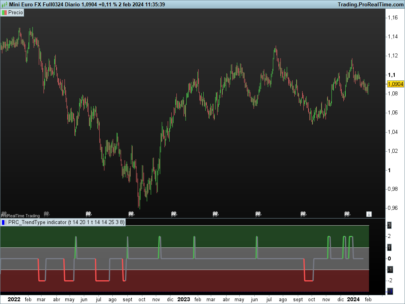
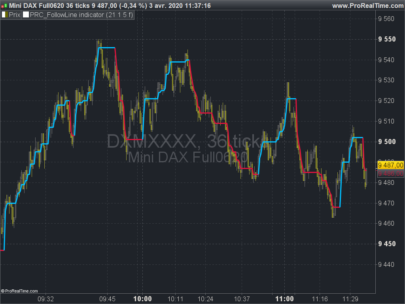
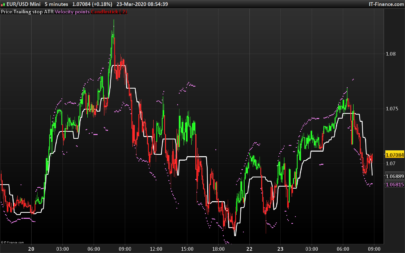
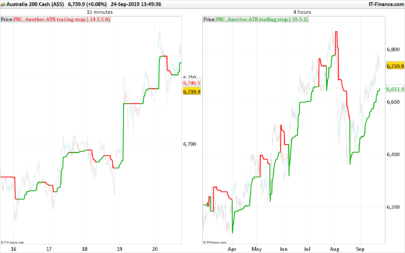
Hi, I downloaded this indicator and imported it. I tried adding it to a chart , and it hasn’t appeared.
– The name appears at the top of the chart price window
– but there is nothing in the chart price window related to it.
– There isn’t an extra window below as in the picture above
Any ideas as to what I am doing wrong?
Thank you
Kind regards
Peter
Don’t add it on the price, so just don’t use the price setting to add the indicator.
Thanks