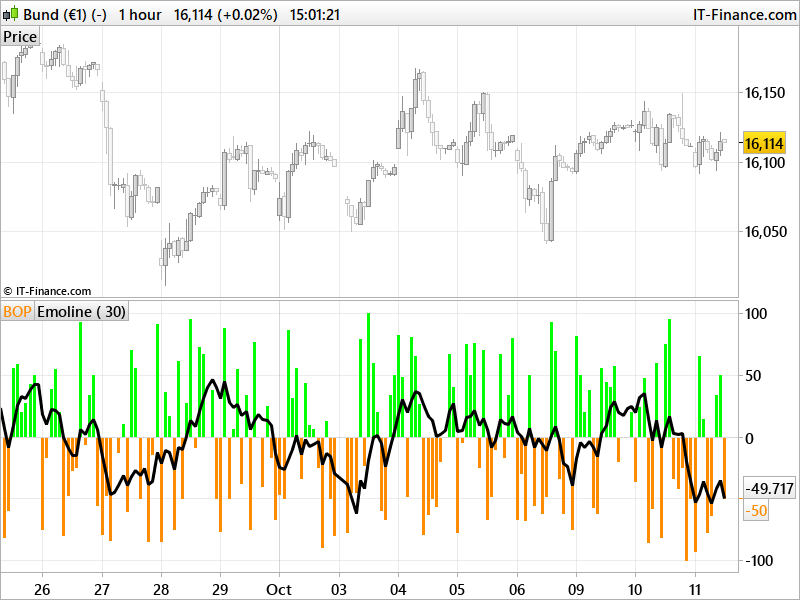
The Balance of Power indicator measures the market strength of buyers against sellers by assessing the ability of each side to drive prices to an extreme level. The calculation is: Balance of Power = (Close price – Open price) / (High price – Low price) The resulting value can be smoothed by a moving average.
Traders may use this indicator to help:
- Identify the direction of a trend.
- Find divergences between the price and the BoP in order to identify a potential trend reversal or trend continuation setup.
- Take advantage of overbought and oversold conditions.
(description found on the web)
Code converted from Pinescript (tradingview) version by a request in the english indicators forum section.
|
1 2 3 4 5 6 7 8 9 10 11 12 13 14 15 16 17 18 19 20 21 22 23 24 |
//PRC_True Balance of Power | indicator //11.10.2017 //Nicolas @ www.prorealcode.com //Sharing ProRealTime knowledge //converted from Pinescript version //---settings //per=30 //periods for Emoline //---end of settings trhi = max(high, close[1]) //true high trlo = min(low, close[1]) //true low trop = close[1] //true open bop = 100*(close-trop)/(trhi-trlo) //True Balance of Power as percent lin= 1.5*linearregression[per](bop) //linear regression as emoline r=0 g=255 if bop<0 then r=255 g=140 endif return bop coloured(r,g,0) style(histogram) as "BOP", lin style(line,3) as "Emoline" |
Share this
No information on this site is investment advice or a solicitation to buy or sell any financial instrument. Past performance is not indicative of future results. Trading may expose you to risk of loss greater than your deposits and is only suitable for experienced investors who have sufficient financial means to bear such risk.
ProRealTime ITF files and other attachments :PRC is also on YouTube, subscribe to our channel for exclusive content and tutorials


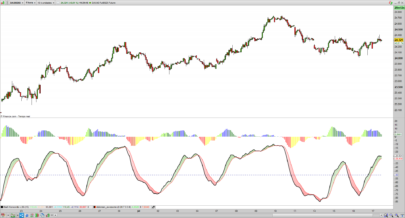


Hi Nicolas, I have this version of the True Balance Power ,created by eykpunter on Tradingview :
and the code :
REM TRUE BALANCE OF POWER
// código original de eykpunter para la plataforma Tradingview
//reforma del script de LazyBear
//@version=3
//adaptado para Prorealtime por bolsatrilera
per=30 //title=”periods for Emoline”, type=integer, step=1, minval=4)
hihi = max(high, close[1])
lolo = min(low, close[1])
opop = close[1]
bop = 100*(close-opop)/(hihi-lolo) //part of range
lin= 1.5*LinearRegression[per](bop)
if lin 0 then
r=154
g=205
b=50
else
r=255
g=165
b=0
endif
return bop coloured (r,g,b)style (histogram)as “True Bop”,lin style(line,2)as “Emoline”, 0 as “0”