Hi traders. I thought we were missing an inside bar breakout failure indicator.
Add it to the price chart.
Inside bar is a famous trading pattern in which the bar carry higher low and lower high compared with the previous bar, also known as mother bar. It’s compatible with any time frame like the 1 hour chart or the daily one. Inside bar pattern will sometimes appears to be similar to a triangle pattern. An inside bar pattern detection is a possible breakout signal by its nature, If you are looking to buy, you need to place a buy-stop entry on the upper part of the inside bar and if you are looking to sell, you may place your sell-stop entry at low of the inside bar.
|
1 2 3 4 5 6 7 8 9 10 11 12 13 14 15 16 17 18 19 20 21 22 23 24 25 26 27 28 29 30 31 32 33 34 35 36 37 38 |
//Inside Bar Breakout Failure indicator atr = averagetruerange[10](close)*0.5 bullcandle=open<close bearcandle=open>close insidebarbear= bearcandle and high[0]<high[1] and low[0]>low[1] if insidebarbear then DRAWTEXT("Inside Bar", barindex, high[1]+atr*0.5, Dialog, Standard, 12) COLOURED(0,0,0) //DRAWARROWDOWN(barindex,high[1]) COLOURED(0,0,0) DRAWCANDLE(open,high,low,close) COLOURED(0,0,0) BORDERCOLOR(255,0,0) endif insidebarbull= bullcandle and high[0]<high[1] and low[0]>low[1] if insidebarbull then DRAWTEXT("Inside Bar", barindex, high[1]+atr*0.5, Dialog, Standard, 12) COLOURED(0,0,0) //DRAWARROWDOWN(barindex,high[1]) COLOURED(0,0,0) DRAWCANDLE(open,high,low,close) COLOURED(0,0,0) BORDERCOLOR(0,255,0) endif insidebarFailureBull=bullcandle and (low[1]<Low[0] or high[1]>high[0]) and(insidebarbull[1] and close[0]<close[1] and close[0]>open[1]) or insidebarbear[1] and close[0]<open[1] and close[0]>close[1] // if insidebarFailureBull and not (insidebarbear or insidebarbull) then DRAWTEXT("Breakout failure", barindex, high[1]+atr*-2.5, Dialog, Standard, 12) COLOURED(0,0,0) DRAWCANDLE(open,high,low,close) COLOURED(255,255,255) BORDERCOLOR(0,255,0) //DRAWARROWUP(barindex,low[0]) COLOURED(0,255,0) endif //================ insidebarFailureBear=bearcandle and (low[1]<Low[0] or high[1]>high[0]) and(insidebarbear[1] and close[0]>close[1] and close[0]<open[1]) or insidebarbull[1] and close[0]>open[1] and close[0]<close[1] if insidebarFailureBear and not (insidebarbear or insidebarbull) then DRAWTEXT("Breakout failure", barindex, high[1]+atr*-2.5, Dialog, Standard, 12) COLOURED(0,0,0) DRAWCANDLE(open,high,low,close) COLOURED(255,255,255) BORDERCOLOR(255,0,0) //DRAWARROWUP(barindex,low[0]) COLOURED(255,0,0) endif RETURN |
Share this
No information on this site is investment advice or a solicitation to buy or sell any financial instrument. Past performance is not indicative of future results. Trading may expose you to risk of loss greater than your deposits and is only suitable for experienced investors who have sufficient financial means to bear such risk.
ProRealTime ITF files and other attachments :PRC is also on YouTube, subscribe to our channel for exclusive content and tutorials


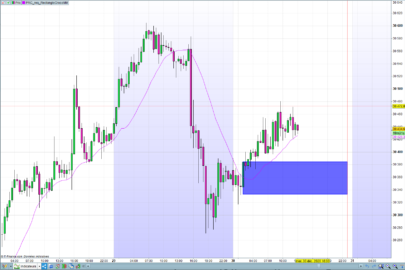

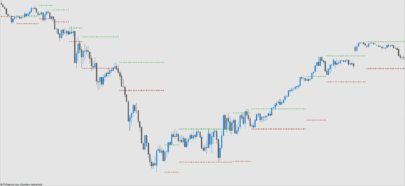
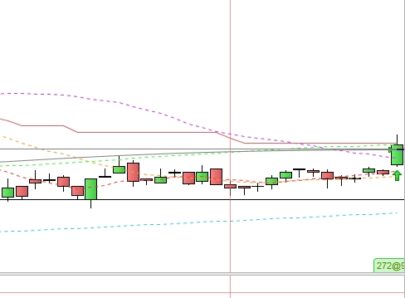
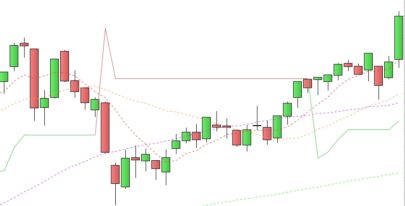
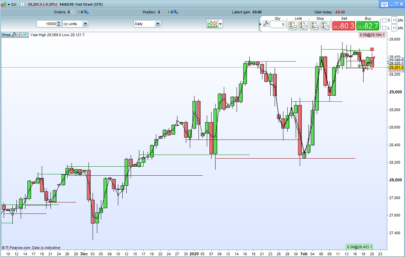
By adding the inside bar breakout failure candle, which is the next bar after the inside bar. Definition is a either higher high, or lower low, but close within the inside bar. The direction of the market usually goes in the opposite direction of either the a higher high or the lower low. A strategy could be to test the low or high of the previous mother bar. Please back test before putting real money in the strategy.
very nice indicator but pls how can we use the indicator without the text (inside
bar/breakout failure)?
Hi Elsborgtrading thanks for this indicator. I was initially looking for a “IDnr4” which I cannot find, but this indicator of yours will sure make things a whole lot easier to spot! Thanks again. Regards