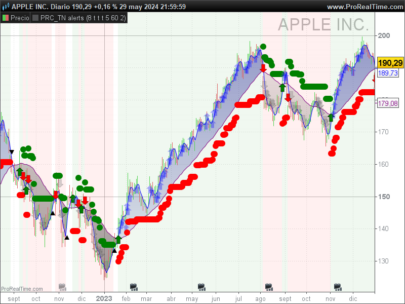
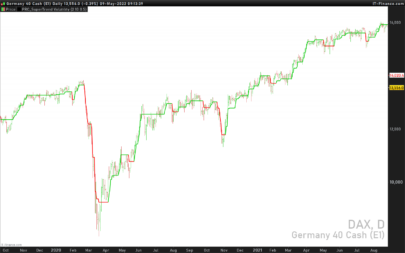
The BBands Stop indicator (Bollinger Bands Stop line) is a trend indicator. When price is over the green curve, the trend is bullish or bearish if the price is below its orange line.
It’s built with bollinger bands phases and act pretty much like a Supertrend, the BBands stop line can also be used to determiner stoploss when you jump in a trend given by its signals (drawn with big “bullets” on chart).
Bollinger bands period and deviation can be changed in settings. The “MoneyRisk” setting is a parameter to widen the spread between the bands and the current price.
This indicator has been translated from MT4 version.
|
1 2 3 4 5 6 7 8 9 10 11 12 13 14 15 16 17 18 19 20 21 22 23 24 25 26 27 28 29 30 31 32 33 34 35 36 37 38 39 40 41 42 43 44 45 46 47 48 49 50 51 52 53 54 55 56 57 58 59 60 61 62 |
//PRC_BBands Stop | indicator //30.03.2017 //Nicolas @ www.prorealcode.com //Sharing ProRealTime knowledge //translated from MT4 code // --- settings //Length=20 // Bollinger Bands Period //Deviation=2 // Deviation //MoneyRisk=1.00 // Offset Factor // --- end of settings avg=average[Length] dev=std[Length]*Deviation smax = avg+dev smin = avg-dev if close>smax[1] then trend=1 endif if close<smin[1] then trend=-1 endif if trend>0 and smin<smin[1] then smin=smin[1] endif if trend<0 and smax>smax[1] then smax=smax[1] endif bsmax=smax+0.5*(MoneyRisk-1)*(smax-smin) bsmin=smin-0.5*(MoneyRisk-1)*(smax-smin) if(trend>0 and bsmin<bsmin[1]) then bsmin=bsmin[1] endif if(trend<0 and bsmax>bsmax[1]) then bsmax=bsmax[1] endif if trend>0 then TrendLine=bsmin r=127 g=255 drawtext("•",barindex,bsmin,Dialog,Standard,10) coloured(r,g,0) if trend[1]<0 then drawtext("•",barindex,bsmin,Dialog,Standard,22) coloured(r,g,0) endif endif if trend<0 then TrendLine=bsmax r=255 g=165 drawtext("•",barindex,bsmax,Dialog,Standard,10) coloured(r,g,0) if trend[1]>0 then drawtext("•",barindex,bsmax,Dialog,Standard,22) coloured(r,g,0) endif endif RETURN TrendLine coloured(r,g,0) style(line,2) as "BBands stop Trend" |
Share this
No information on this site is investment advice or a solicitation to buy or sell any financial instrument. Past performance is not indicative of future results. Trading may expose you to risk of loss greater than your deposits and is only suitable for experienced investors who have sufficient financial means to bear such risk.
ProRealTime ITF files and other attachments :PRC is also on YouTube, subscribe to our channel for exclusive content and tutorials








Thanks Nicolas,
Are your sure ? When you lower the Moneyrisk you have no more return of the price ?
Yes, the “moneyrisk” setting can be adjusted to enlarge the difference between the price and the BBands stop line.
Ok thanks Nicolas 🙂
Bonjour Ncolas,
Comment changer la couleur des lignes en rouge et vert un peux foncé
Je vous remercie
Je vous remercie
Ligne 44 à modifier par r=0
Ligne 55 à modifier par g = 0
J’ai simplement codé en dur les couleurs d’origine de l’indicateur, je pensai bien faire 🙂
Bonjour Nicolas,
Je vous remercie
L’indicateur est très intéressant
Après c’est une question de couleur 😀
Cordialement
Les goûts et les couleurs…
Good evening Nicolas,
Can you add an option coloring the candlesticks?
Thanks
Bonjour Nicolas,
je n’arrive pas faire marcher l’indicateur, il m’indique en message d’erreur :
Erreurs de Syntaxe :
Veuillez définir les variables suivantes :
Length
deviation
moneyrisk
Pourriez vous m’aider s’il vous plaît
merci d’avance
Veuillez décommenter les lignes des variables (enlever les //), ou télécharger et importer directement l’indicateur dans votre plateforme de trading.
Bonjour Nicolas, j’ai le même problème que Youness ! Qu’entendez-vous par “décommenter les lignes des variables” ? Je vous remercie.
Supprimer les //
Good evening Nicolas,
Is it possible to turn this indicator into a screener?
Thanks
Yes sure, please make a new topic/query in the appropriate forum.
Great indicator, I love it ! Thank you Nicolas !
L’intégration de cet indicateur dans PRT me donne un schéma latéral sous la charte. Que faut-il changer pour redresser l’indicateur le long des chandeliers dans la charte. Merci d’avance pour votre réponse.
L’appliquer sur la charte.
Je vous remercie Nicolas pour cette réponse rapide.
J’ai importé le fichier .itf puis ajouter à la charte, mais l’indicateur reste latéral au bas de la charte et non dans la charte.
Que faut-il changer dans le code? Je vous remercie.
Rien, il faut l’appliquer sur la charte. Soit le mettre sur le graphique du prix, à l’aide de la petite clé qui se trouve en haut à gauche du graphique.
Merci pour votre réponse. Je l’applique sur la charte, j’utilise la petite clé pour effacer le remplissage, mais l’indicateur s’étale sous la charte comme l’indicateur RSI par exemple avec ses lignes orange et verte. Il n’est pas linéaire au prix dans la charte.
Merci encore pour votre aide.
Je vous remercie, Nicolas. C’est fixé. Très bon week-end.