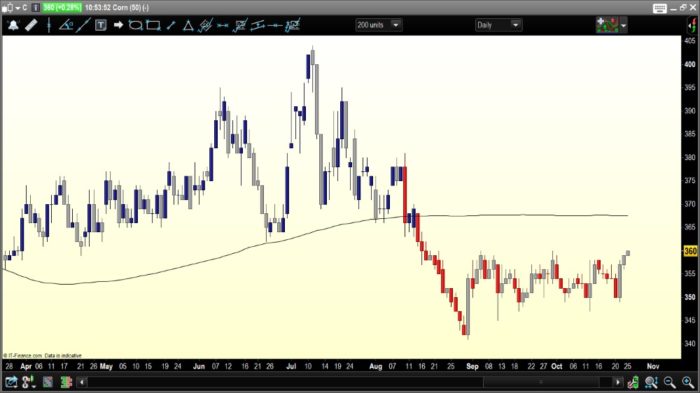
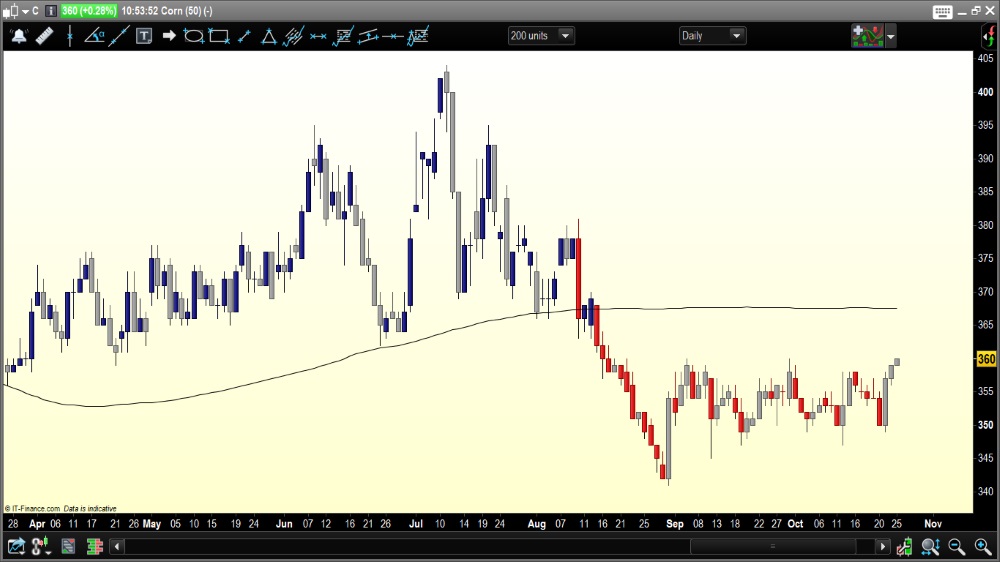
To identify your bias for a market at a glance, I have developed the Bias Determinator indicator. The indicator shows blue candles when the bias is bullish and red candles when the bias is bearish. When the bias is bullish, neutral candles (bearish candles in a bullish bias) are light gray. In opposit, when the bias is bearish, ( bullish candles in a bearish bias) are also light gray. The indicator is based on Raghee Horner’s GRaB indicator. For this example (attachement) I have used the (visible) MA200 to identify the bias. You can tweak this yourself to invisible or another moving average.
|
1 2 3 4 5 6 7 8 9 10 11 12 13 14 15 16 17 18 19 20 21 22 23 24 25 26 27 28 29 30 31 32 33 34 35 36 37 38 39 40 41 42 43 44 45 46 47 48 49 50 51 52 53 54 55 56 57 58 |
//Bias Determinator indicator //24-10-2017 //Marcel van Vliet //--- parameters // mmTYPE=1 (mm type) // --- MA=average[200] bodyhigh = max(open,close) bodylow = min(open,close) if(open<=close and close > MA) then LongWickUp = high LongCandleUp = bodyHigh LongWickDown = low LongCandleDown = bodyLow elsif(open>=close and close > MA) then LongWickUp = low LongCandleUp = bodyLow LongWickDown = high LongCandleDown = bodyHigh elsif(open<=close and close < MA) then ShortWickUp = high ShortCandleUp = bodyHigh ShortWickDown = low ShortCandleDown = bodyLow elsif(open>=close and close < MA) then ShortWickUp = low ShortCandleUp = bodyLow ShortWickDown = high ShortCandleDown = bodyHigh endif //bullish candlesticks if close>MA then DRAWCANDLE(LongCandleDown,LongWickUp,LongWickDown,LongCandleUp) coloured(0,0,102) Endif //Neutral candlesticks above the MA If close>MA and close<open then DRAWCANDLE(LongCandleDown,LongWickUp,LongWickDown,LongCandleUp) coloured(150,150,150) Endif //bearish candlesticks if close<MA then DRAWCANDLE(ShortCandleDown,ShortWickUp,ShortWickDown,ShortCandleUp) coloured(200,0,0) Endif //Neutral candlesticks under the MA If close<MA and close>open then DRAWCANDLE(ShortCandleDown,ShortWickUp,ShortWickDown,ShortCandleUp) coloured(150,150,150) Endif RETURN |
Share this
No information on this site is investment advice or a solicitation to buy or sell any financial instrument. Past performance is not indicative of future results. Trading may expose you to risk of loss greater than your deposits and is only suitable for experienced investors who have sufficient financial means to bear such risk.
ProRealTime ITF files and other attachments :PRC is also on YouTube, subscribe to our channel for exclusive content and tutorials







For those who are interested, I post trade opportunities with this indicator on Twitter. (@MvvTrading)
Thank you for sharing, best regards