Legendary trader Bill Williams, an early pioneer of market psychology, developed a number of original technical indicators in a career that spanned more than five decades.
The Alligator indicator uses three smoothed moving averages, set at 5, 8, and 13 periods, which are all Fibonacci numbers. The initial smoothed average is calculated with a simple moving average (SMA), adding additional smoothed averages that slow down indicator turns.
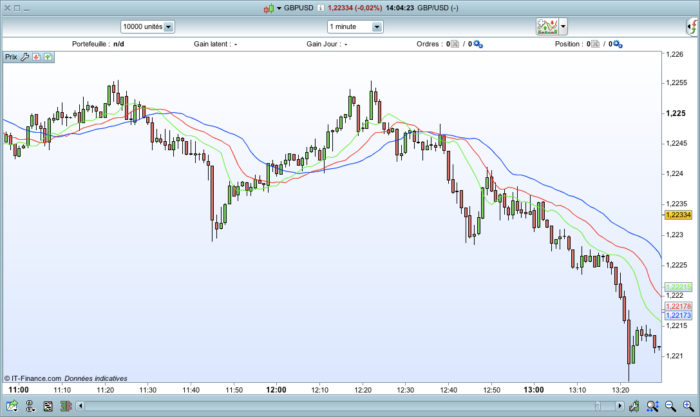
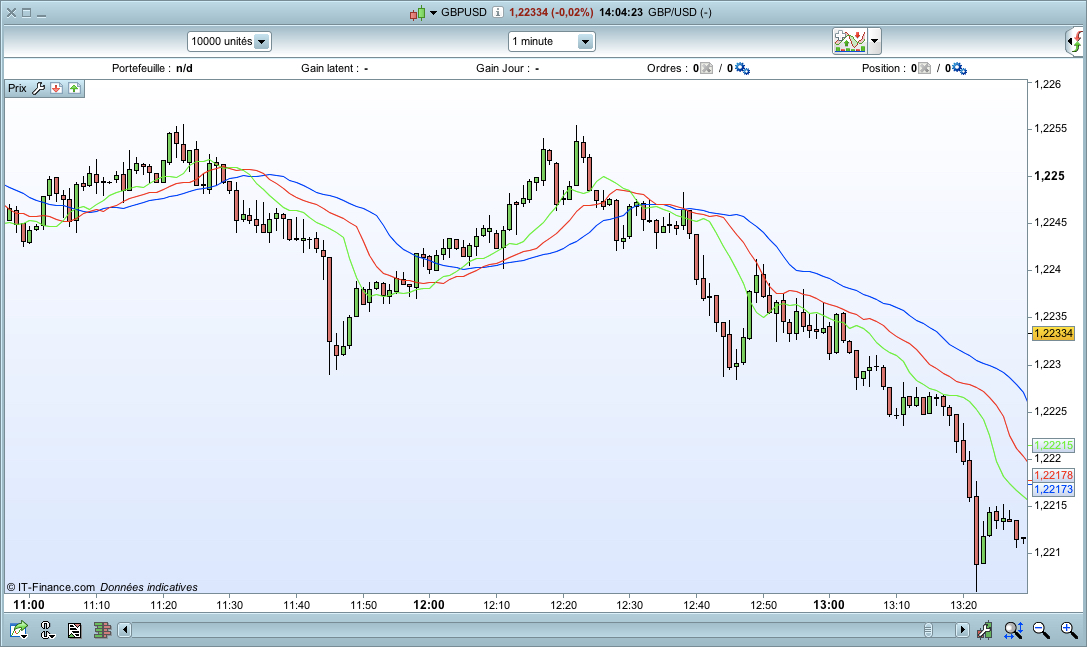
Three moving averages comprise the Jaw (blue), Teeth (red), and Lips (green) of the Alligator, opening and closing in reaction to evolving trends and trading ranges.
The three lines stretched apart and moving higher or lower denote trending periods in which long or short positions should be maintained and managed. This is referred to as the alligator eating with mouth wide open. Indicator lines converging into narrow bands and shifting toward a horizontal direction denote periods in which the trend may be coming to an end, signaling the need for profit taking and position realignment.
Works on any instrument and any timeframe.
|
1 2 3 4 5 6 7 8 9 10 11 12 13 14 15 16 17 18 19 |
REM Alligator Indicator - Bill Williams // Alligator Blue Line - Jaw // 13 bar smoothed average future 8 bars SSMAblue = WilderAverage[13](close[8]) // Alligator Red Line - Teeth // 8 bar smoothed average future 5 bars SSMAred = WilderAverage[8](close[5]) // Alligator Green Line - Lip // 5 bar smoothed average future 3 bars SSMAgreen = WilderAverage[5](close[3]) RETURN SSMAblue COLOURED(0,0,255) AS"Jaw", SSMAred COLOURED(255,0,0) AS"Teeth", SSMAgreen COLOURED(0,255,0) AS"Lips" |
Share this
No information on this site is investment advice or a solicitation to buy or sell any financial instrument. Past performance is not indicative of future results. Trading may expose you to risk of loss greater than your deposits and is only suitable for experienced investors who have sufficient financial means to bear such risk.
ProRealTime ITF files and other attachments :PRC is also on YouTube, subscribe to our channel for exclusive content and tutorials






HELP, WHY DONT I NOT GOT THE INDICATOR IN CHART. JUST UNDER?????????????
Use the wrench on the upper left side of your price chart to add correctly indicator on PRICE.
Hi Nicolas, has the indicator you developed the same scoped described at this page?
http://fxcodebase.com/wiki/index.php/Fractal_Indicator
If yes, would it be possible to have it with arrows like in that page? Thanks
This is the Bill Williams’ Alligator not fractals.
I have found this comment. https://www.prorealcode.com/reply/36015/
Is the code currenty correct?
The code is correct, don’t know if the label and color are the same as other trading software, just compare 🙂
Hi Nicolas, the settings of the alligators are not editable. How can I change it? Thanks in advance
I got very bad performance with this script, it was slow… it seems like if one breaks out a few values it’s faster, try this…
REM Alligator Indicator – Bill Williams
// Alligator Blue Line – Jaw
// 13 bar smoothed average future 8 bars
SSMAbluePeriods = 13
SSMAblueOffset = 8
SSMAblueSeries = close[SSMAblueOffset]
SSMAblue = WilderAverage[SSMAbluePeriods](SSMAblueSeries)
// Alligator Red Line – Teeth
// 8 bar smoothed average future 5 bars
SSMAredPeriods = 8
SSMAredOffset = 5
SSMAredSeries = close[SSMAredOffset]
SSMAred = WilderAverage[SSMAredPeriods](SSMAredSeries)
// Alligator Green Line – Lip
// 5 bar smoothed average future 3 bars
SSMAgreenPeriods = 5
SSMAgreenOffset = 3
SSMAgreenSeries = close[SSMAgreenOffset]
SSMAgreen = WilderAverage[SSMAgreenPeriods](SSMAgreenSeries)
RETURN SSMAblue COLOURED(0,0,255) AS”Jaw”, SSMAred COLOURED(255,0,0) AS”Teeth”, SSMAgreen COLOURED(0,255,0) AS”Lips”