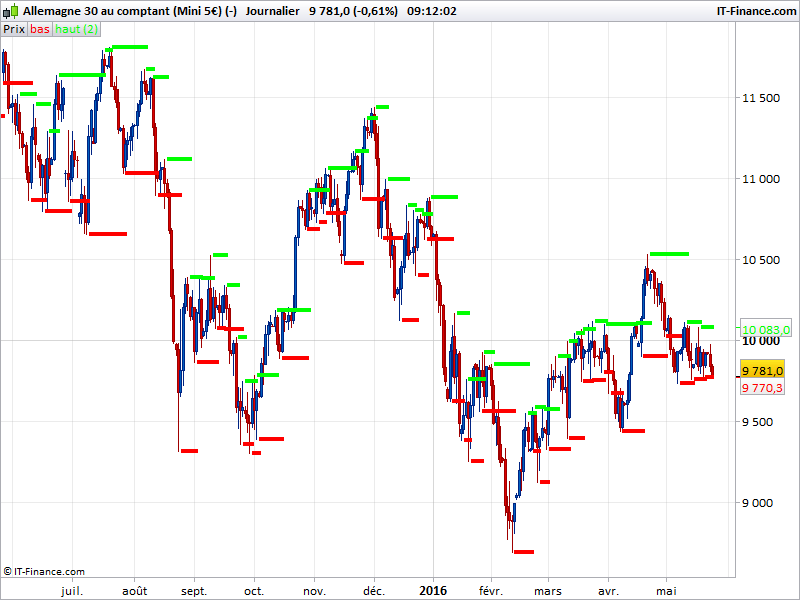
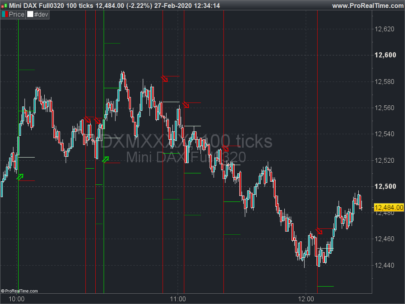
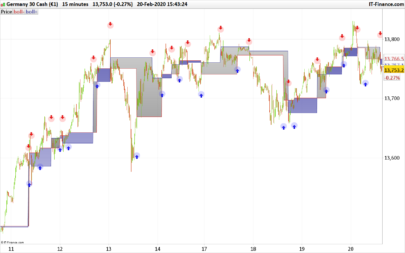
“In order for a fractal to form, there should be a series of 5 consecutive bars where the middle bar will be the highest preceded and followed by two lower neighbouring bars on each side.”
Since this indicator is frequently requested on forums, I put the code here (author: SOHOCOOL).
Fractals can be used in many different approach:
- Market points reversal
- Breakout of recent fractals points
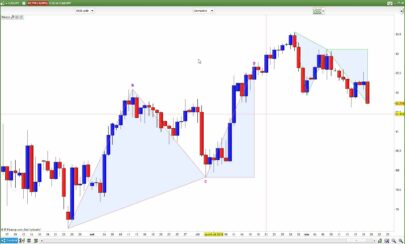
- Trend line drawn from recent fractals
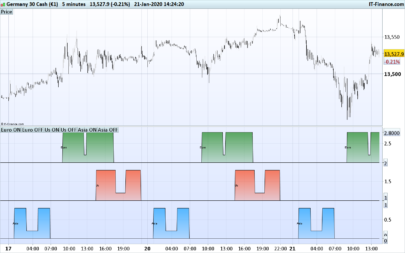
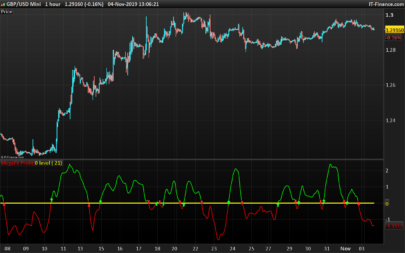
The “Low Fractal” and “High Fractal” may be set to ‘points’ style in the platform to have a clearer view of them on the price chart.
|
1 2 3 4 5 6 7 8 9 10 11 12 13 14 15 16 17 18 19 20 21 22 23 24 25 26 27 28 29 |
/////////// FRACTALS BILL WILLIAMS //Variable: //cp = 2 (default) if high[cp] >= highest[2*cp+1](high) then LH = 1 else LH=0 endif if low[cp] <= lowest[2*cp+1](low) then LL= -1 else LL=0 endif if LH=1 then hil = high[cp] endif if LL = -1 then LOL=low[cp] endif return lol coloured(255,0,0) as "Low Fractal",hil coloured(0,255,0) as "High Fractal" /////////////end |
Share this
No information on this site is investment advice or a solicitation to buy or sell any financial instrument. Past performance is not indicative of future results. Trading may expose you to risk of loss greater than your deposits and is only suitable for experienced investors who have sufficient financial means to bear such risk.
ProRealTime ITF files and other attachments :
Find other exclusive trading pro-tools on ![]()
PRC is also on YouTube, subscribe to our channel for exclusive content and tutorials


Hi Nicolas,
Thanks for sharing, interesting code.
Maybe someone could make a strategy based on it.Best regards,
I get the lines, but cannot get the segments?
set the “Low Fractal” and ‘High Fractal” to points and not lines.
If you do it like follows, it prints arrows instead of lines.
You’re welcome.
if high[cp] >= highest[2*cp+1](high) then
LH = 1
else
LH=0
endif
if low[cp] <= lowest[2*cp+1](low) then
LL= -1
else
LL=0
endif
if LH=1 then
DRAWARROWUP(barindex[2], high[cp]*1.05)
endif
if LL = -1 then
DRAWARROWDOWN(barindex[2], low[cp]*0.93)
endif
RETURN
Thanks a lot! Share of any kind are always appreciated! 😉
Hi,
Thanks for posting this, I have tried to put it on my charts but I am getting it in a separate window rather than on the chart, is there anything I have to do with the settings?
I tried the other one with the arrows but I am getting an error with line 14 and 15 due to a ( not being expected?
I would really appreciate any help,
Kind regards,
Vig
Please use the wrench on the upper left corner of the chart to add an indicator on the price chart. The other indicators with arrows is only compatible with prorealtime version 10.3.
Hi – bit of an old post but hopefully you see my comment lol.
I’m trying to add this Williams Fractal indicator to my ProRealtime charts and it’s not working, it adds like a box on the bottom ( same way MACD or RSI does) and not on the actual price chart.
I use 70 tick charts, any ideas? Thanks!
Add it on the price by using the wrench on the left upper side of the price chart.
Hi Nicolas,
Thank you for the quick reply and I have now been able to get the indicator on the price rather than in a separate window.
My next question is I now have two consecutive lines like a bollenger bands rather than lines at the highs and lows of the price. How do I get it to look like the picture above? I am running 10.2 is that the problem?
Set it as points and not lines, in the indicator’s window parameters.
Perfect, thank you Nicolas! 🙂
ça marche pas PRT me dit erreur de syntaxe : cp ? veuillez définir la variable
Bien entendu, la ligne 4 est commenté! 🙂
OK mais on fait comment, pour un gros nul de la programmation comme moi ?
Il faut simplement supprimer les // ou ajouter cette variable dans les paramètres de l’indicateur
je comprend pas ? ça ma marche pas
il faudrait un exemple, merci
La ligne 4 doit ressembler à ceci:
cp = 2
Tu pourras changer la valeur 2 par celle qui te convient également.
ça donne pas le même indicateur que celui montrer ? c’est normal
“cp”, c’est un paramètre que l’on peut modifier à volonté. Sinon pour avoir les points, il faut paramètrer les valeurs retournées en mode “point”.
Hi, the ver, with arrows is this only for PRT, 10.3?
I get errors in ver 10.2
Cheers Kasper
I can see that the graphical instruction for DRAWARROW is only for PRT V.10.3 so there’s the error.
buongiorno
cosa si deve mettere al posto di
DRAWARROWUP
mi potete dare un codice gia completo per il fractal?grazie
Syntax errors for ver 10.2, not tried it on 10.3.
Any of you get this to work on 10.2??
cheers
Please uncomment the line 4 or use the imported ITF file instead.
Hi there Here is the code than i had to modifie a bit as the arrows weren’t in the right places,above/under the candles. I have also added colour for better understanding.
cp=2
if high[cp] >= highest[2*cp+1](high) then
LH = 1
else
LH=0
endif
if low[cp] <= lowest[2*cp+1](low) then
LL= -1
else
LL=0
endif
if LH=1 then
DRAWARROWUP(barindex[2], high[cp]+0.0001)coloured(0,255,0)
endif
if LL = -1 then
DRAWARROWDOWN(barindex[2], low[cp]-0.0001)coloured(255,10,10)
endif
RETURN
Thank you for sharing this modification. In previous PRT version (before 10.3), it was impossible to draw in past history, that’s why the fractals were not placed at the exact fractals candlesticks.
Slightly modified, for those interested (I hope I didn’t make mistakes)
/////////// FRACTALS BILL WILLIAMS//Variable:
//cp = 2 (default)
cp = 2
if (High[cp] > High[cp+2]) AND (High[cp] > High[cp+1]) AND (High[cp] > High[cp-1]) AND (High[cp] > High[cp-2]) thenLH = 1elseLH=0endif
if (Low[cp] < Low[cp+2]) AND (Low[cp] < Low[cp+1]) AND (Low[cp] < Low[cp-1]) AND (Low[cp] < Low[cp-2]) thenLL= -1elseLL=0endif
if LH=1 thenDRAWARROWUP(barindex[cp], High[cp]*1.0008) COLOURED(0,10,255)endif
if LL = -1 thenDRAWARROWDOWN(barindex[cp], Low[cp]*0.9992) COLOURED(255,0,10)
endifRETURN
/////////////end
What is the piece of code that must be added to make it draw lines, to the extreme right of the chart, from the 2 most recent fractals?
… in a few words a Fractal Channel….
… that you posted at the beginning
sorry… delete post if you want
Hello there Nicolas,
Is there a way of coding the arrow fractal for it to alarm when it appears?
Thank you,
Adam
You can already use the alarm tool to trigger alerts with the red/green dots of this indicator.
Why do I get this error when I try to add the arrows please?
“One of the following characters would be more suitable than “if”?”
Try the code from this comment: https://www.prorealcode.com/prorealtime-indicators/bill-williams-fractals/#comment-1000
Thanks Nicolas. Same response. It gives an error for the word ‘if’.
Do you have version 10.3? What broker?
Yes 10.3, IG Markets.
Merci Nicolas,
j’ai pris l’option points ce qui fait des quasi segment sur des UT courtes ( jour) mais en hebdo c’est plus light, est-ce possible d’avoir un segment continu (l’option proposée par PRT ligne + points génère des lignes reliant les fractales ce qui alourdit le graphe). Merci par avance
Hi, I was looking for an asymmetrical fractal to be set on Pro Real Time and I have found the code on this page. Unfortunately it gives a syntax error: define the variable cp
Yes define it. Uncomment the cp variable (delete the //) or just download the itf file and import it directly into the platform to get this setting available in the indicator’s window.
Thank you. I could upload it on the Pro Real Time platform, but it is not the same indicator in the Image. It shows a green segmented line above, a red segmented line below and a Grey area between them. I need an indicator for the poitioning of a continuously moving stop loss (like a trailng stop). Here it is better explaied: https://www.dailyfx.com/forex/education/trading_tips/daily_trading_lesson/2014/05/09/The-More-Intelligent-Trailing-Stop.htmlhttps://www.dailyfx.com/forex/education/trading_tips/daily_trading_lesson/2014/05/09/The-More-Intelligent-Trailing-Stop.html
You only need to set these lines to points in the indicator settings.
I deleted the //, but it gives a further error on line 4
Please download the file and import it.
Hi Nicolas, thank you for your answer. Nothing has been changed after having applied your instructions. The indicator that I have is completely different from what is expected to be. How can I send you a screenshot?
You can find the screenshot at the following link: https://ibb.co/gfvPkR
I hope it helps
Please add it on your price chart instead (click on the wrench on the left upper side of your price chart) and remove the color zone.
Hi Nicolas, thank you for your answer. I clicked on the wrench but after that I don’t know where to remove the color zone. I have also asked my broker.
To remove the color zone, just delete it in the indicator settings.
I would like to have the same Indicator showed at the beginning of this page. It would be comprehensible for me with the same settings that are in the Image, otherwise I don’t know to read it
Hi Nicolas, is it possible to make this into the black background?? as when you put this into the black background on PRT.. it shows a white colour in between the green and red lines?
oops sorry.. i manage to get that out!! thanks!!
How its possible to change the number of candles needed for the fractal formed???
Thanks
Yes, change the quantity with the Cp variable at the beginning of the code.
Hi, great indicator. However, when I put it on as an indicator it doesn’t show up the chart but rather a new indicator tab below. Sorry if this is basic, I’m quite new. Any thoughts? Thanks very much!
add it on price by using the wrench at the upper left side of the price chart.
Hi Nicolas, I am trying to change this indicator to work with 3 candles instead of 5 but cannot get it to work properly when changing the CP. Any suggestions please?
Regards
Patric
Je vous suggère de faire une recherche sur le site avec le mot clé ‘fractals’, il existe beaucoup de versions différentes, peut-être que l’une d’entre elles vous apportera satisfaction.
Dear Nicolas,
all the best for 2019 and thanks for this contribution. I love this indicator, because it combines both powerful Regression and Williams Fractals concepts. Since I am not skilled enough to convert this into an automated scalping system, I really would appreciate if you could give an advice how to code the long/short signals here (see question above from „verygrubby“). At least it would be very helpful to me, to know how I can generate an acoustic signal (just a „beep“) in addition to the point plotting. I know, how to create alerts (https://www.prorealtime.com/en/videos_tutorial/135_create_alerts) but code-generated alerts would be much more flexible. Thanks a lot in advance!
Hi All,
I’ve made some fixes & upgrades so that this single script can either used as an overlay, as a separate indicator panel, or even as a “function” to provide a basic signal (up/down only) for use in automated trading:
// Required variables (default) [description]:
// – N (2) [Real-time delay / bars to look both back and forward]
bwfSig = 0
r = 255
g = 255
b = 255
IF (High[N] >= Highest[2*N+1](High)) AND (High[N] > Highest[N](High)) THEN
bwfSig = -1
ELSIF (Low[N] <= Lowest[2*N+1](Low)) AND (Low[N] < Lowest[N](Low)) THEN
bwfSig = 1
ENDIF
IF bwfSig = -1 THEN
DRAWARROWDOWN(barindex[N], high[N] + Averagetruerange[100]/3) Coloured(255,10,10)
r = 204
g = 0
b = 0
ELSIF bwfSig = 1 THEN
DRAWARROWUP(barindex[N], low[N] – Averagetruerange[100]/3) Coloured(0,255,0)
r = 0
g = 153
b = 0
ENDIF
RETURN bwfSig Coloured (r,g,b) Style(Histogram, 1)
Again, this does not return the actual levels but that would be trivial to add in as a future upgrade.
Also note that each signal will arrive ‘N’ periods late – but that is the nature of the beast!
Enjoy.