







Bill Williams Profitunity
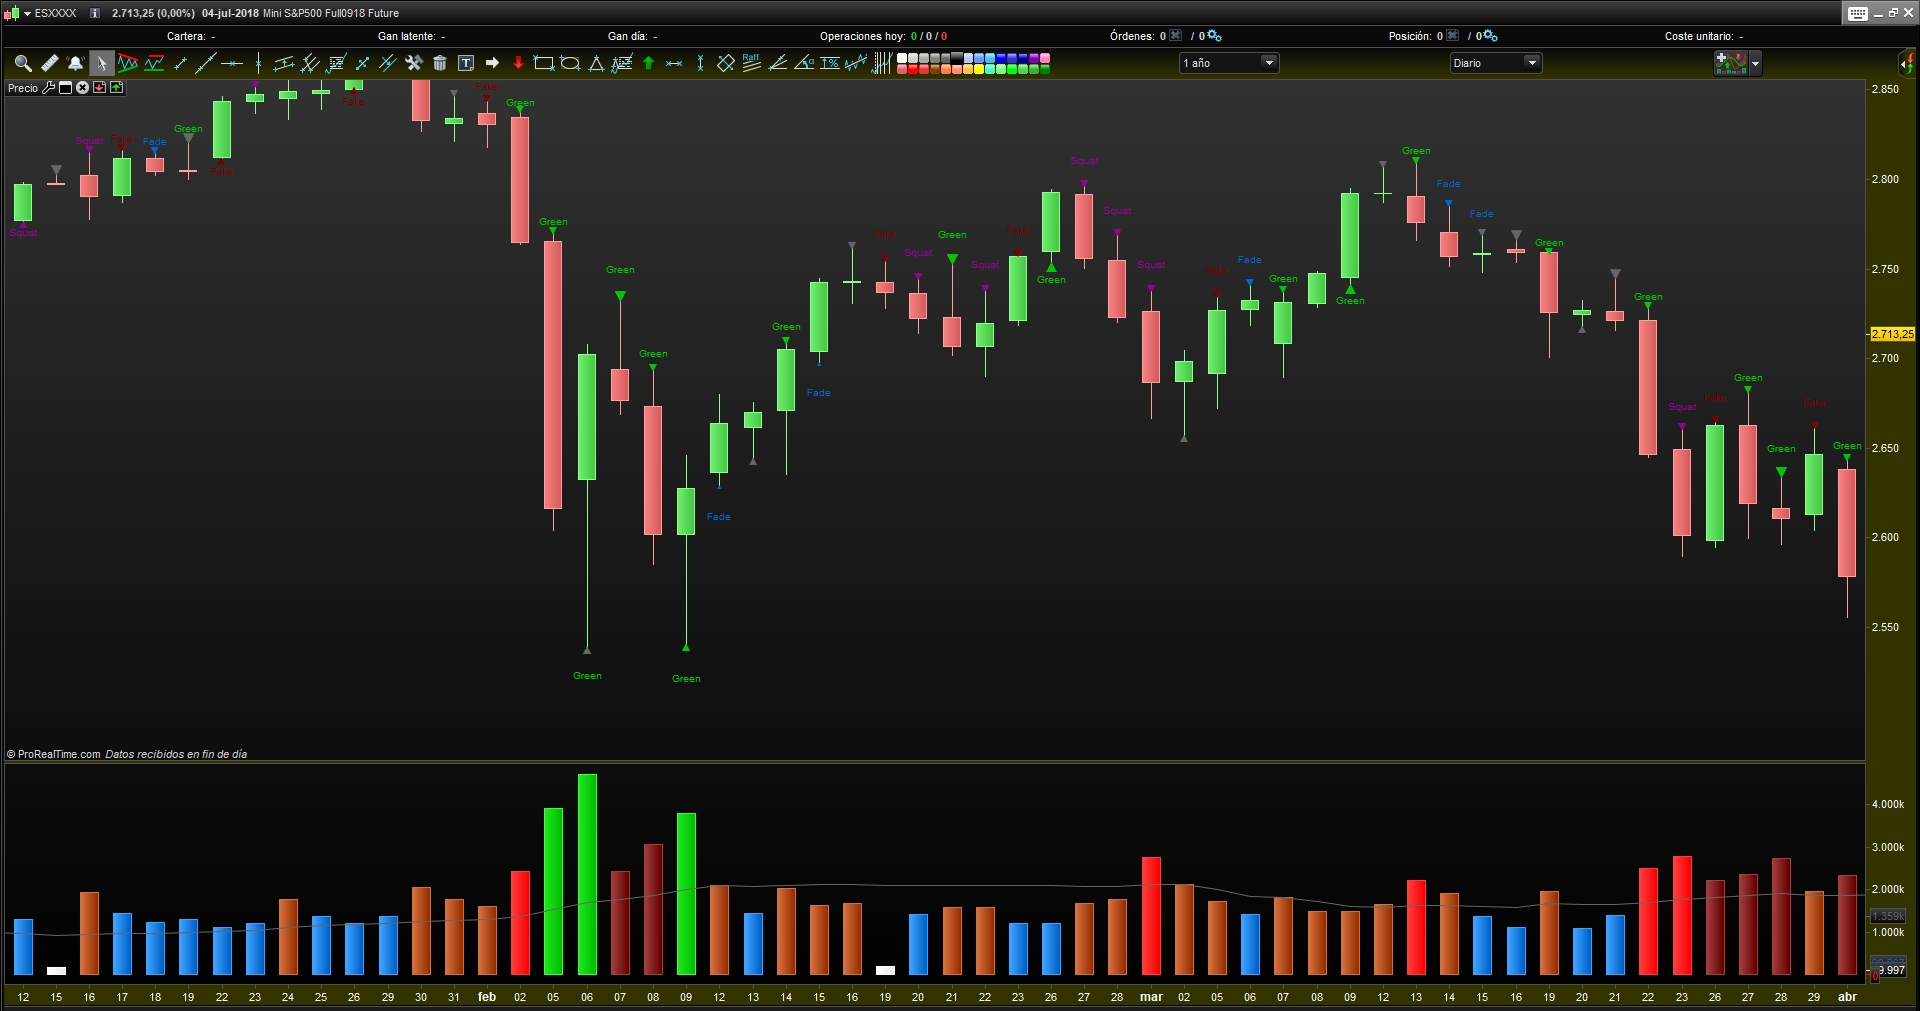
Another method of studying Price and Volume by Bill Williams Profitunity
The Bill Williams Profitunity provides a unique way of quantifying price movement relative to volume. At the heart of it is the Market Facilatation Index (MFI). The MFI is the bar’s range (high – low) divided by the volume. Using the MFI, each bar has a mathematical relationship of the price activity versus the volume. In essence, the MFI is a measurement of market efficiency, tracking how much movement has occurred in price relative to volume. By comparing the MFI for the current bar to the previous bar’s, you can gauge the current bar’s ability to facilitate price to the previous bar’s ability. The Bill Williams Profitunity can be used on any period from daily bars to monthly bars.
The MFI as a stand-alone indicator has little value. However, by comparing the current bar’s MFI and volume with the previous bar’s MFI and volume, a very tradable system emerges.
Williams defines the four possible combinations of MFI and volume as follows. A plus sign means the current bar’s value is greater than the previous bar’s value. A minus sign means the current bar’s value is less than the previous bar’s value.
Volume MFI Label:
- Green //Green
- Fade //Blue
- Fake //Red
- Squat //Violet
Green. This bar shows an increase in volume and the MFI relative to the previous bar. Hence, there is price movement, and the MFI is larger for this bar than that for the previous bar. Further, more players are entering the market as signaled by the increase in volume. This activity in the futures market means that off-floor traders are very active. In addition, the price action is directional–that is, the market is moving in one direction due to the involvement of new traders putting on new positions. This is the kind of day that you would already want to have a trade on in the same direction.
Fade. This bar shows a decrease in volume and the MFI relative to the previous bar. The market has slowed and there is a minor amount of activity as indicated by the low volume. This type of day is called a fade, as the traders’ interest in the market by this point is fading. Often, this sort of day happens at the end of a trend. The market has simply reached a point where nobody is willing to establish any new positions. At this point the market appears to be suffering from a certain amount of boredom. Keep in mind, however, that out of this market condition, a new trend could emerge.
Fake. This bar shows a decrease in volume but an increase in the MFI. This condition means that the market is moving more relative to the previous bar (the greater MFI), but the lack of volume is evidence that there is no new participation. The price action may be driven by just the traders in the pit and is not attracting new players from the outside. Williams has an hypothesis, that the traders in the pit may be just strong enough to push the market to price levels where there are many stop orders resting in the hands of the brokers, hence faking out the off-floor traders.
Squat. This bar shows an increase in volume relative to the previous bar, but the MFI is lower. The increase in volume indicates heavy activity, but the decrease in the MFI indicates that the market is unable to make any real headway. Volume increased, the trend has stalled and the price movement has stopped. This price action usually, but not always occurs prior to an important move in the opposite direction. This type of bar is called a squat bar because the market appears to be squatting prior to a breakout. Often, the breakout of such a bar will indicate whether this squat is a trend reversal squat or a trend continuation squat.
///////////////////////////////////////////////////////////////////////////////

atr = averagetruerange[10](close)*0.5
Vol=volume
linea=4
Lineb=0.0001

smavol = average[500](vol)
stdvol =std[500](vol)
sma = average[50](vol)

If stdvol > linea then
 av=(smavol +linea*stdvol)
else
 av=0
endif

if stdvol> lineb then
 bv=(smavol +lineb*stdvol)
else
 bv=0
endif

MFI0 = (high - low) / volume
MFI1 = (high[1] - low[1]) / volume[1]

MFIplus = MFI0 > MFI1
MFIminus = MFI0 < MFI1

meanplus = (high + low) /2 > high[1]
meanminus = (high + low) /2 < high[1]

volplus = volume > volume[1]
volminus = volume < volume[1]

b13 = open < (high + low) /2 and close > (high + low) /2 and close > open
b31 = open > (high + low) /2 and close < (high + low) /2 and close < open

a0 = open > (high + low) /2 and close > (high + low) /2 and close > open
if a0 then
 DrawText("▴",barindex,low,SansSerif,Standard,20)coloured(102,102,102)
endif

b0= open < (high + low) /2 and close < (high + low) /2 and close > open
if b0 then
 DrawText("▾",barindex,high,SansSerif,Standard,20)coloured(102,102,102)
endif

c0 = open < (high + low) /2 and close < (high + low) /2 and close < open
if c0 then
 DrawText("▾",barindex,high,SansSerif,Standard,30)coloured(102,102,102)
endif

d0 = open > (high + low) /2 and close > (high + low) /2 and close < open
if d0 then
 DrawText("▾",barindex,high,SansSerif,Standard,30)coloured(102,102,102)
endif

//////////////////////////////////////////////////////////////////////////////////////////////////////////////

a0 = open > (high + low) /2 and close > (high + low) /2 and close > open and vol > av[1]
if a0 then
 DrawText("▴",barindex,low,SansSerif,Standard,20)coloured(0,200,0)
 DrawText("Green",barindex,low-atr/2,SansSerif,Standard,10)coloured(0,200,0)
endif

b0= open < (high + low) /2 and close < (high + low) /2 and close > open and vol < bv[1]
if b0 then
 DrawText("▾",barindex,high,SansSerif,Standard,20)coloured(0,102,204)
 DrawText("Fade",barindex,High+atr/2,SansSerif,Standard,10)coloured(0,102,204)
endif

c0 = open < (high + low) /2 and close < (high + low) /2 and close < open and vol > sma[1]
if c0 then
 DrawText("▾",barindex,high,SansSerif,Standard,30)coloured(0,200,0)
 DrawText("Green",barindex,high+atr/2,SansSerif,Standard,10)coloured(0,200,0)
endif

d0 = open > (high + low) /2 and close > (high + low) /2 and close < open and vol > sma[1]
if d0 then
 DrawText("▾",barindex,high,SansSerif,Standard,30)coloured(153,0,153)
 DrawText("Squat",barindex,high+atr/2,SansSerif,Standard,10)coloured(153,0,153)
endif

a= meanplus and b13 and volplus and MFIplus
if a then
 DrawText("▴",barindex,low,SansSerif,Standard,30)coloured(0,200,0)
 DrawText("Green",barindex,low-atr/4,SansSerif,Standard,10)coloured(0,200,0)
endif

b = meanplus and b13 and volminus and MFIminus
if b then
 DrawText("▴",barindex,low,SansSerif,Standard,10)coloured(0,102,204)
 DrawText("Fade",barindex,low-atr/2,SansSerif,Standard,10)coloured(0,102,204)
endif

c = meanplus and b13 and volminus and MFIplus
if c then
 DrawText("▴",barindex,low,SansSerif,Standard,20)coloured(128,0,0)
 DrawText("Fake",barindex,low-atr/2,SansSerif,Standard,10)coloured(128,0,0)
endif

d = meanplus and b13 and volplus and MFIminus
if d then
 DrawText("▴",barindex,low,SansSerif,Standard,20)coloured(153,0,153)
 DrawText("Squat",barindex,low-atr/2,SansSerif,Standard,10)coloured(153,0,153)
endif

e = meanminus and b13 and volplus and MFIplus
if e then
 DrawText("▾",barindex,high,SansSerif,Standard,20)coloured(0,200,0)
 DrawText("Green",barindex,high+atr/4,SansSerif,Standard,10)coloured(0,200,0)
endif

f = meanminus and b13 and volminus and MFIminus
if f then
 DrawText("▾",barindex,high,SansSerif,Standard,20)coloured(0,102,204) //blue
 DrawText("Fade",barindex,high+atr/2,SansSerif,Standard,10)coloured(0,102,204)
endif

g = meanminus and b13 and volminus and MFIplus
if g then
 DrawText("▾",barindex,high,SansSerif,Standard,20)coloured(128,0,0)
 DrawText("Fake",barindex,high+atr/2,SansSerif,Standard,10)coloured(128,0,0)
endif

j = meanminus and b13 and volplus and MFIminus
if j then
 DrawText("▾",barindex,high,SansSerif,Standard,20)coloured(153,0,153)
 DrawText("Squat",barindex,high+atr/2,SansSerif,Standard,10)coloured(153,0,153)
endif

i = meanplus and b31 and volplus and MFIplus
if i then
 DrawText("▴",barindex,low,SansSerif,Standard,20)coloured(0,200,0)
 DrawText("Green",barindex,low-atr/4,SansSerif,Standard,10)coloured(0,200,0)
endif

o = meanplus and b31 and volminus and MFIminus
if o then
 DrawText("▴",barindex,low,SansSerif,Standard,20)coloured(0,102,204)//blue
 DrawText("Fade",barindex,low-atr/2,SansSerif,Standard,10)coloured(0,102,204)
endif

t = meanplus and b31 and volminus and MFIplus
if t then
 DrawText("▴",barindex,low,SansSerif,Standard,20)coloured(128,0,0)
 DrawText("Fake",barindex,low-atr/2,SansSerif,Standard,10)coloured(128,0,0)
endif

aa = meanplus and b31 and volplus and MFIminus
if aa then
 DrawText("▴",barindex,low,SansSerif,Standard,20)coloured(153,0,153)
 DrawText("Squat",barindex,low-atr/2,SansSerif,Standard,10)coloured(153,0,153)
endif

bb = meanminus and b31 and volplus and MFIplus
if bb then
 DrawText("▾",barindex,high,SansSerif,Standard,20)coloured(0,200,0)
 DrawText("Green",barindex,high+atr/4,SansSerif,Standard,10)coloured(0,200,0)
endif

cc = meanminus and b31 and volminus and MFIminus
if cc then
 DrawText("▾",barindex,high,SansSerif,Standard,20)coloured(0,102,204) //blue
 DrawText("Fade",barindex,high+atr/2,SansSerif,Standard,10)coloured(0,102,204)
endif

dd = meanminus and b31 and volminus and MFIplus
if dd then
 DrawText("▾",barindex,high,SansSerif,Standard,20)coloured(128,0,0)
 DrawText("Fake",barindex,high+atr/2,SansSerif,Standard,10)coloured(128,0,0)
endif

ee = meanminus and b31 and volplus and MFIminus
if ee then
 DrawText("▾",barindex,high,SansSerif,Standard,20)coloured(153,0,153)
 DrawText("Squat",barindex,high+atr/2,SansSerif,Standard,10)coloured(153,0,153)
endif

drawcandle(open,high,low,close)

return
Comments
You must be logged in to post a comment.

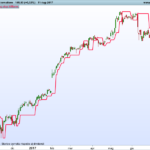
Thanks but the links broken and I can’t find it by searching for parts of the URL? I am not sure why you posted an image of Williams Price / Volume Indicator and then gave a posted code that is not Williams code? Your code makes it harder to actually read the volume changes because your indicator floats (and references ATR) and is not based on the x-axis. Thanks again for your input.
What you are looking for is the Market Facilitation Index (MFI), which has nothing to do with this indicator. Now I understand why I wanted to convert it into Histogram ... First you should be informed of the differences of one or the other indicator to request or make changes ... if NO you know the bases of the indicators.
What you have is an evolution of an indicator validated by its authors .. What Ulted seeks is for payment .. and for them if you want it you can pay it in other platforms ... You have to know how to differentiate between an evolution of an original indicator. Instead of criticizing the work, you should develop it yourself.
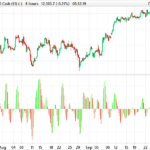
The code will not "add" so here it is: Bill Williams' Price/Volume Indicator: //Bill Williams' Price/Volume Indicator MFI = RB / V RB = Range //high-low in points V = Volume MFI0 = Range / Volume MFI1 = (Range[1]) / Volume[1] MFIPlus = MFI0 > MFI1 MFIMinus = MFI0 Volume[1] VolMinus = Volume < Volume[1] if MFIPlus and VolPlus then MFI1=MFI MFI2=0 MFI3=0 MFI4=0 elsif MFIMinus and VolMinus then MFI1=0 MFI2=MFI MFI3=0 MFI4=0 elsif MFIPlus and VolMinus then MFI1=0 MFI2=0 MFI3=MFI mfi4=0 elsif MFIMinus and VolPlus then MFI1=0 MFI2=0 MFI3=0 MFI4=MFI endif return MFI1 coloured (0,255,0) as "Follow Trend Green", MFI2 coloured (0,0,255) as "Fade Blue", MFI3 coloured (255,0,0) as "Fake Red", MFI4 coloured (255,0,255) as "Squat Violet"
//Bill Williams Profitunity MFI0 = RANGE*(high - low) / volume MFI1 = RANGE*(high[1] - low[1]) / volume[1] MFIplus = MFI0 > MFI1 MFIminus = MFI0 high[1] meanminus = (high + low) /2 volume[1] volminus = volume < volume[1] b13 = open (high + low) /2 and close > open[1] b31 = open > (high + low) /2 and close < (high + low) /2 and close < open[1] ////////////////////////////////////////////////////////////////////////////////////////////////////////////// a= meanplus and b13 and volplus and MFIplus if a then signal =1 endif b = meanplus and b13 and volminus and MFIminus if b then signal =1 endif c = meanplus and b13 and volminus and MFIplus if c then signal =1 endif d = meanplus and b13 and volplus and MFIminus if d then signal =1 endif e = meanminus and b13 and volplus and MFIplus if e then signal =1 endif f = meanminus and b13 and volminus and MFIminus if f then signal =1 endif g = meanminus and b13 and volminus and MFIplus if g then signal =1 endif j = meanminus and b13 and volplus and MFIminus if j then signal =1 endif /////////////////////////////////////////////////////////////////////////////////////////////////////////////// i = meanplus and b31 and volplus and MFIplus if i then signal =-1 endif o = meanplus and b31 and volminus and MFIminus if o then signal =-1 endif t = meanplus and b31 and volminus and MFIplus if t then signal =-1 endif aa = meanplus and b31 and volplus and MFIminus if aa then signal =-1 endif bb = meanminus and b31 and volplus and MFIplus if bb then signal =-1 endif cc = meanminus and b31 and volminus and MFIminus if cc then signal =-1 endif dd = meanminus and b31 and volminus and MFIplus if dd then signal =-1 endif ee = meanminus and b31 and volplus and MFIminus if ee then signal =-1 endif if signal =1 then r=0 g=128 b=0 else r=128 g=0 b=0 endif return signal coloured (r,g,b) style(histogram)
Thanks, I have tried altering and adding my amended code many times but without getting the indicator to work.. I'm not sure I understand what you meant by, "substitute everything"? I've removed: atr = averagetruerange[10](close)*0.5 and drawcandle(open,high,low,close) and replaced with "return signal" I've removed all reference to atr within the code so a line of code now reads e.g: "Fake",barindex,high..., (instead of the original "Fake",barindex,high+atr/2... ). I have done that for all atr's so they all now read as either "low," (instead or "low+atr/2"), or "high," (instead of "high+atr/2"). (I appreciate that the apostrophes " " only surround the words like Fake etc) I have placed "signal = 1" or "signal = -1" for every condition from (a) to (ee). E.g: ee = meanminus and b31 and volplus and MFIminus if ee then DrawText("▾",barindex,high,SansSerif,Standard,20)coloured(153,0,153) DrawText("Squat",barindex,high,SansSerif,Standard,10)coloured(153,0,153) signal = -1 endif Any ideas what I am doing wrong? Thanks again,
remove the ATR, and drawcandle (open, high, low, close) substitute everything DrawText ("▾", barindex, high, SansSerif, Standard, 20) colored (200,0,0) DrawText ("", barindex, high + atr / 2, SansSerif, Standard, 10) colored (200,0,0) signal = -1 substitute everything DrawText ("▴", barindex, low, SansSerif, Standard, 20) colored (153,0,153) DrawText ("", barindex, low-atr / 2, SansSerif, Standard, 10) colored (153,0,153) signal = 1 return signal

"Bacon with speed" is a new one on me, Apologies, the link was not working on my iphone but works okay on my Macbook. Thanks. I am not criticising, and there is no need to take any offence, I am simply stating a fact. Where is this image at the top of this page that you posted taken from? Is it Williams original indicator or an evolution by a programmer, because to me, it looked exactly like the Williams Price/Vol indicator that I had seen on the web and which I assumed was the code I was downloading in the in the itf file. But as I later realised it was not, as you clearly have explained above and that this code on this page is for an evolution of Williams' code. Hence my request for a histogram fixed to the x-axis like WIlliams' indicator, so it is very easy to see volume differences -- That mismatching of the images was confusing but it's no big deal, really. If you had posted the floating ATR candlesticks image I wouldn't have downloaded it and then spent hours trying to configure it to be like WIlliams' intended it to be! I hope I got it right though but you have not said of the code I posted is good? Anyway, I was simply after the original code. Best, Bard