1. Introduction
The BlackFlags FTS indicator is a technical tool designed to dynamically highlight phases of consolidation and trending movements in financial markets. Its structure, based on colored zones, provides a quick visual interpretation of price context, showing not only the prevailing direction but also key areas where price is ranging or compressing.
This type of graphical representation helps traders avoid entering during uncertain zones and improves their ability to detect meaningful breakouts, whether bullish or bearish. BlackFlags FTS is especially useful for traders who want to filter out market “noise” and focus on moments of real trading opportunity.
The name “BlackFlags” refers to those “warning flag” zones that clearly mark transitions between equilibrium (range) and disequilibrium (trend) phases.
2. How the BlackFlags FTS Indicator Works
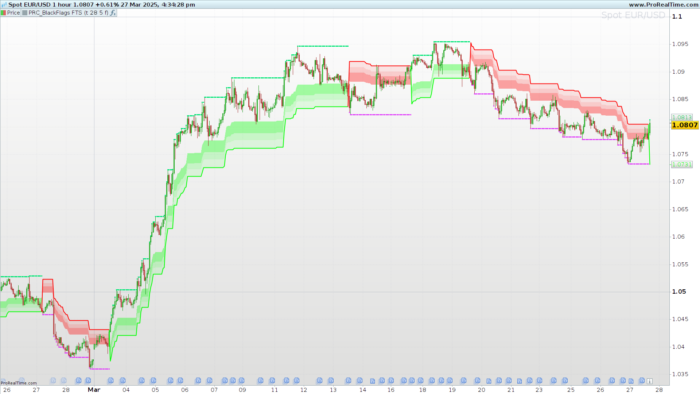
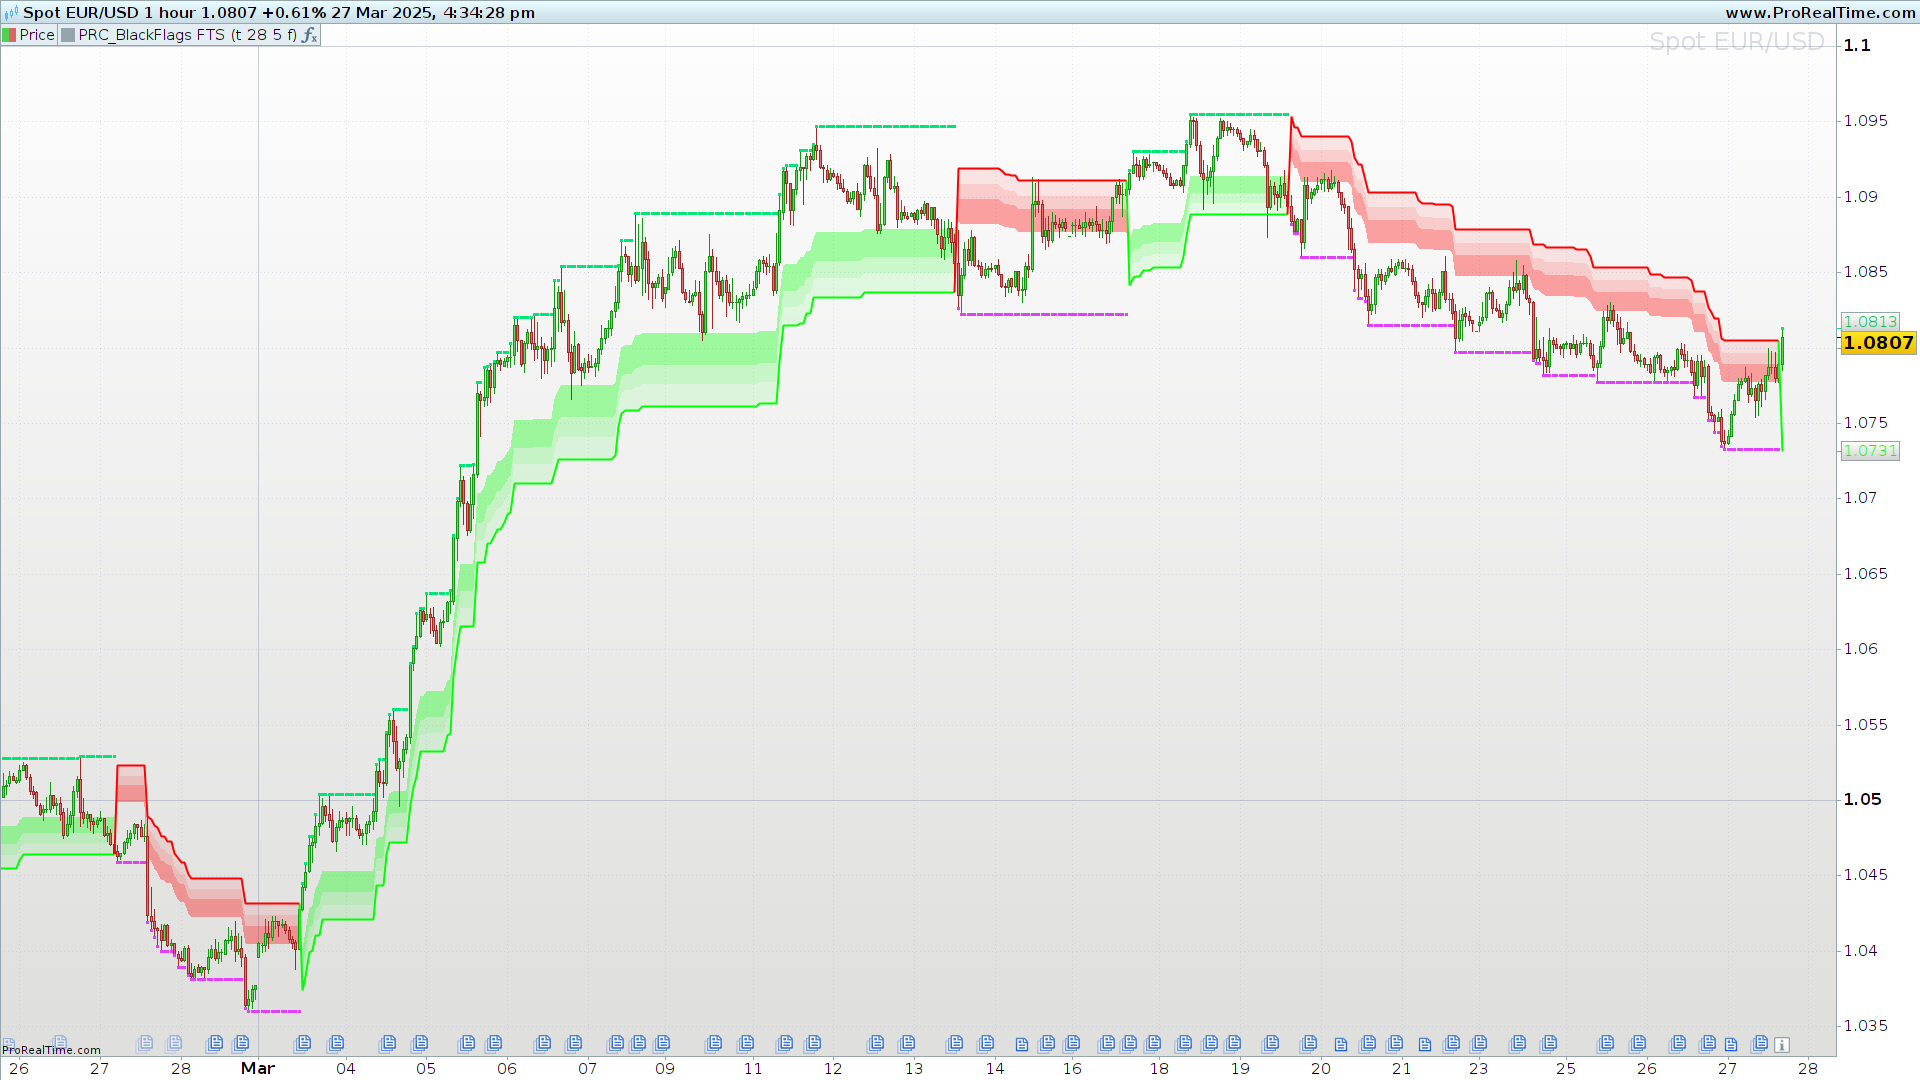
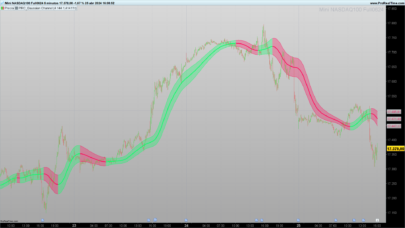
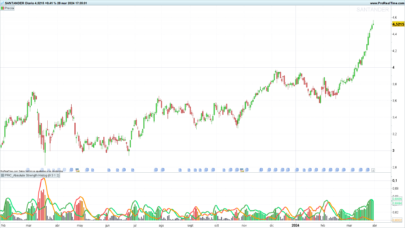
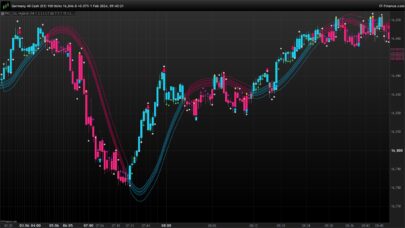
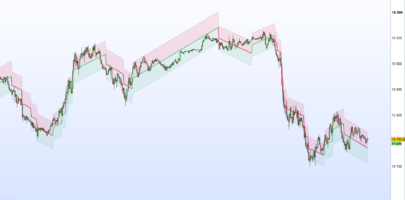
The BlackFlags FTS indicator operates by dynamically identifying trend and consolidation phases using a colored band structure that adapts to price behavior.
These bands are based on logic that detects when the price stops trending and enters a lateral range. At those times, the indicator marks blocks or congestion zones (flags), which may signal a pause in the trend or a potential reversal.
Color zones:
- Green zones: indicate bullish phases with directional and sustained movement. These often accompany upward momentum and consolidation blocks above the current price.
- Red zones: indicate bearish phases, where selling pressure dominates and the price forms descending ranges.
- Dashed horizontal lines: define the upper and lower boundaries of the detected range. These zones act as breakout levels:
- A breakout above the upper boundary may trigger a bullish move.
- A breakdown below the lower boundary may trigger a bearish move.
Intermediate tones (light green or light red) add nuance, highlighting transitional or weakening phases within the trend.
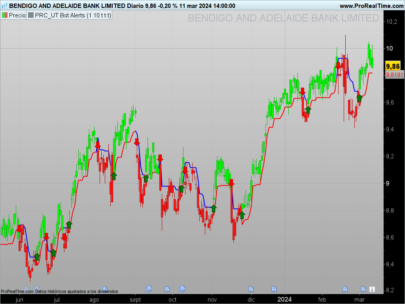
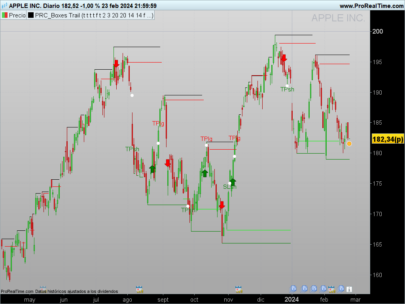
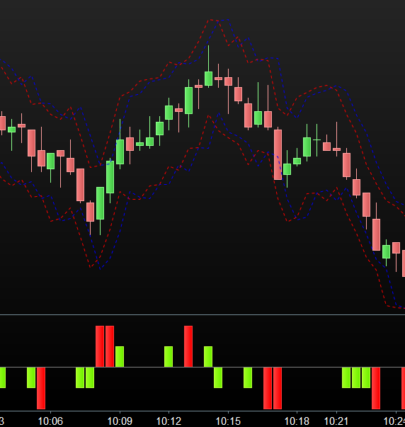
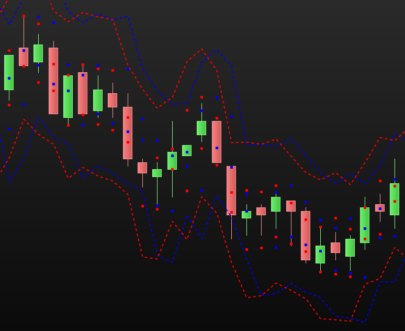
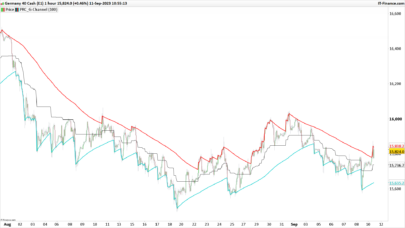
3. Chart Interpretation
One of the key strengths of the BlackFlags FTS is its visual clarity. The color-coded zones let traders instantly identify the prevailing market phase: trending, ranging, or transitioning.
Key interpretations:
- Dark green zone: strong bullish trend, price moves with conviction, potential for breakout continuation.
- Dark red zone: strong bearish trend, consistent lower highs/lows, downward momentum.
- Lighter tones: transitional phases or trend exhaustion, potentially signaling a pause or reversal.
- Dashed horizontal levels: key support/resistance levels based on previous consolidations. Breaking these can lead to new impulsive movements.
In essence, the indicator helps traders:
- Avoid trades during uncertain range conditions.
- Spot breakout opportunities from clear consolidation.
- Visualize dynamic zones of support and resistance.
4. Indicator Settings
The BlackFlags FTS indicator includes customizable parameters, allowing users to adapt it to different asset types and trading styles.
Configurable parameters:
- Sensitivity / Base period
- Controls how quickly the indicator reacts to price movements.
- Lower values = faster reactions (for scalping/intraday).
- Higher values = smoother zones (ideal for swing or daily charts).
- Minimum range width
- Filters out narrow or irrelevant zones.
- Higher values avoid false signals from minor consolidations.
- Breakout tolerance
- Adjusts how strictly the indicator defines a breakout.
- Higher tolerance reduces noise and limits false breakout signals.
- Custom colors
- Personalize the color scheme for bullish, bearish, neutral zones and range lines.
5. Advantages and Use Cases
BlackFlags FTS is not just another trend or range indicator. Its hybrid design offers a visual and contextual edge that is especially helpful for traders who value contextual filtering and clean setups.
Main advantages:
- Clear identification of market phases (trend vs range).
- Filters out market noise and low-probability zones.
- Anticipates meaningful breakouts from consolidation.
- Pairs well with oscillators, candlestick patterns, or signal systems.
Ideal for:
- Range trading: identifying accumulation/distribution zones.
- Strategic breakouts: spotting potential breakouts with higher conviction.
- Swing trading: preparing positions before impulsive moves.
- Context confirmation: supporting other systems with structural context.
The BlackFlags FTS becomes a visual compass to navigate complex market structures, helping traders focus on setups with true potential and avoid misleading movements.
6. ProBuilder Code
|
1 2 3 4 5 6 7 8 9 10 11 12 13 14 15 16 17 18 19 20 21 22 23 24 25 26 27 28 29 30 31 32 33 34 35 36 37 38 39 40 41 42 43 44 45 46 47 48 49 50 51 52 53 54 55 56 57 58 59 60 61 62 63 64 65 66 67 68 69 70 71 72 73 74 75 76 77 78 79 80 81 82 83 84 85 86 87 88 89 90 91 92 93 94 95 96 97 98 99 100 101 102 103 104 105 106 107 108 109 110 111 112 113 114 115 116 117 118 119 120 121 122 123 124 125 126 127 128 129 130 131 132 133 134 135 |
"//------------------------------------------------// //PRC_BlackFlags FTS //version = 0 //27.03.2025 //Iván González @ www.prorealcode.com //Sharing ProRealTime knowledge //------------------------------------------------// // Inputs //------------------------------------------------// trailType=1 //modified=1 unmodified=0 atrPeriod=28 atrFactor=5 ShowFibEntries=0 //------------------------------------------------// // True Range Calculations //------------------------------------------------// HiLo=min(high-low,1.5*average[atrPeriod](high-low)) if low<=high[1] then Href=high-close[1] else Href=(high-close[1])-0.5*(low-high[1]) endif if high>=low[1] then Lref=close[1]-low else Lref=(close[1]-low)-0.5*(low[1]-high) endif if trailType=1 then trueRange=max(HiLo,max(Href,Lref)) else trueRange=max(high-low,max(abs(high-close[1]),abs(low-close[1]))) endif //------------------------------------------------// // Trade Logic //------------------------------------------------// wildMa=WilderAverage[atrPeriod](trueRange) iloss=atrFactor*wildMa up=close-iloss dn=close+iloss trendUp=up trendDown=dn trend=1 if close[1]>trendUp[1] then TrendUp=max(Up,TrendUp[1]) else TrendUp=Up endif if close[1]<trendDown[1] then trendDown=min(Dn,trendDown[1]) else trendDown=Dn endif if close>trendDown[1] then Trend=1 elsif close<TrendUp[1] then Trend=-1 else Trend=Trend[1] endif if trend=1 then trail=TrendUp r=0 g=255 b=0 rex=0 gex=230 bex=118 else trail=TrendDown r=255 g=0 b=0 rex=225 gex=64 bex=251 endif ex=0 if trend crosses over 0 then ex=high elsif trend crosses under 0 then ex=low elsif trend=1 then ex=max(ex[1],high) elsif trend=-1 then ex=min(ex[1],low) else ex=ex[1] endif //------------------------------------------------// // Fibonacci levels //------------------------------------------------// fib1Level=61.8 fib2Level=78.6 fib3Level=88.6 f1=ex+(trail-ex)*fib1Level/100 f2=ex+(trail-ex)*fib2Level/100 f3=ex+(trail-ex)*fib3Level/100 l100=trail colorbetween(f1,f2,r,g,b,90) colorbetween(f3,f2,r,g,b,45) colorbetween(f3,l100,r,g,b,23) //------------------------------------------------// // Signals //------------------------------------------------// atr=averagetruerange[14](close) if ShowFibEntries=1 then if trend=1 and close crosses under f3[1] then drawtext(""▲"",barindex,low-2*atr)coloured(""orange"") elsif trend=1 and close crosses under f2[1] then drawtext(""▲"",barindex,low-1.5*atr)coloured(""orange"") elsif trend=1 and close crosses under f1[1] then drawtext(""▲"",barindex,low-1*atr)coloured(""orange"") elsif trend=-1 and close crosses over f3[1] then drawtext(""▼"",barindex,high+2*atr)coloured(""purple"") elsif trend=-1 and close crosses over f2[1] then drawtext(""▼"",barindex,high+1.5*atr)coloured(""purple"") elsif trend=-1 and close crosses over f1[1] then drawtext(""▼"",barindex,high+1*atr)coloured(""purple"") endif endif //------------------------------------------------// return f1 as ""Fib1""style(line,1), f2 as ""Fib2""style(line,1),f3 as ""Fib3""style(line,1),l100 as ""L100""style(line,1),trail as ""trailing stop"" coloured(r,g,b)style(line,2),ex as ""extremun"" coloured(rex,gex,bex)style(point,2)" |
Share this
No information on this site is investment advice or a solicitation to buy or sell any financial instrument. Past performance is not indicative of future results. Trading may expose you to risk of loss greater than your deposits and is only suitable for experienced investors who have sufficient financial means to bear such risk.
ProRealTime ITF files and other attachments :
Find other exclusive trading pro-tools on ![]()
PRC is also on YouTube, subscribe to our channel for exclusive content and tutorials


Excelente trabajo!!
Bonsoir est-il possible d’avoir cet indicateur, mais à la place du Wilder Average, utiliser le nuage Ichimoku? Excellente soirée