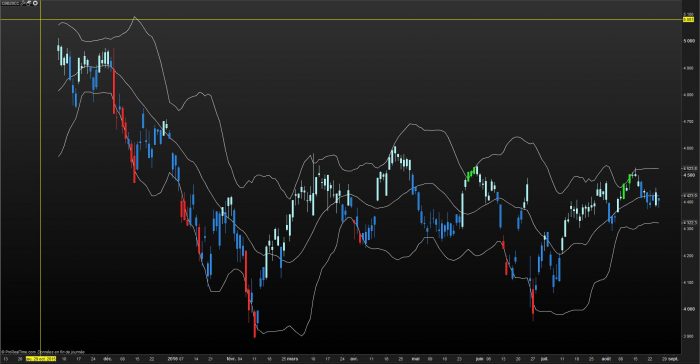
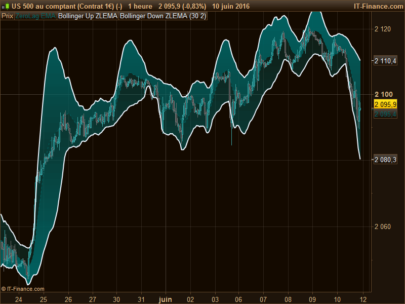
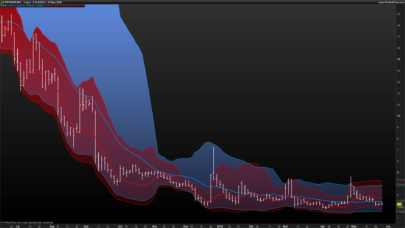
![]() Voici un indicateur basé sur les bandes de Bollinger, les bougies changent de couleurs selon leur “close”
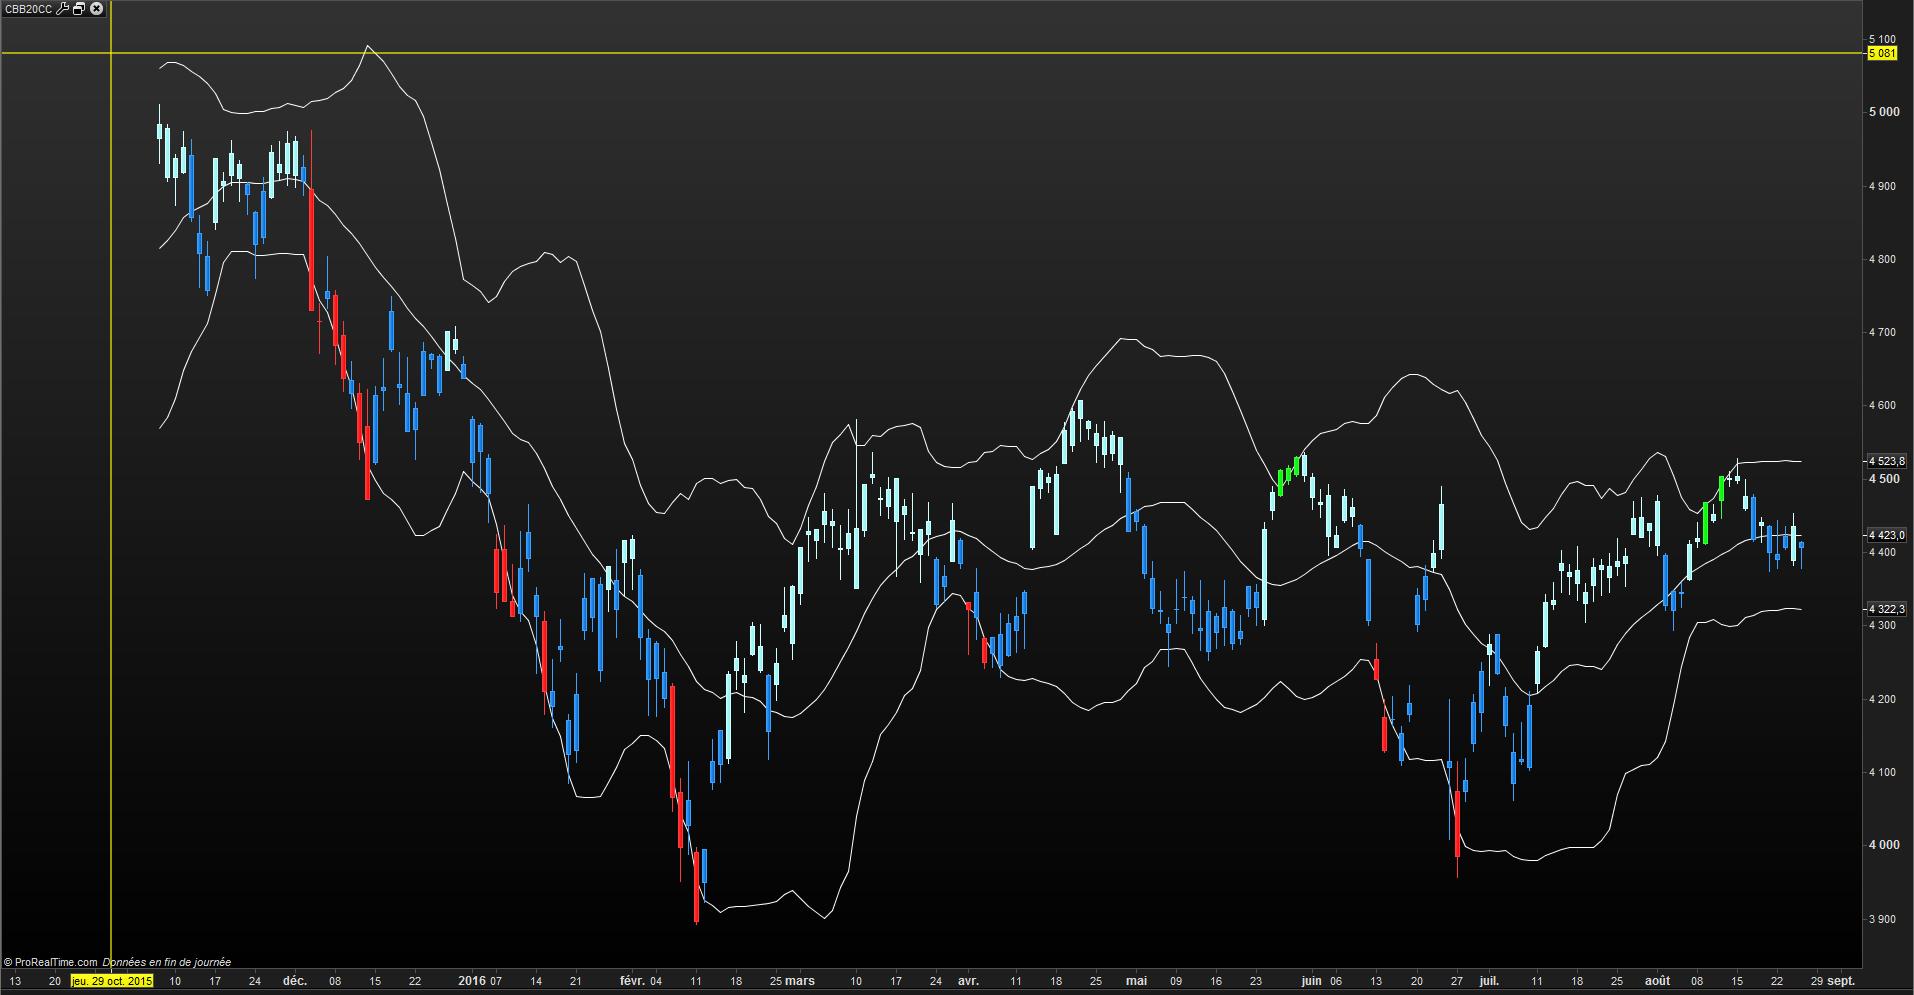
Voici un indicateur basé sur les bandes de Bollinger, les bougies changent de couleurs selon leur “close”
au dessus de la bande haute = vert
entre le milieu et le haut = bleu ciel
sous la bande basse = rouge
entre le milieu et la bande basse = bleu
Vous pouvez adapter le système à vos bandes préférées
bons trades.
![]() Here is an indicator based on Bollinger Bands, candles change color according to their “close”
Here is an indicator based on Bollinger Bands, candles change color according to their “close”
High above the band = green
between the middle and up = light blue
under lowest band = red
between the middle and the lowest band = blue
You can adapt the system to your prefered bands
good trades.
|
1 2 3 4 5 6 7 8 9 10 11 12 13 14 15 16 17 18 19 20 21 22 23 |
// CLOSE BB20 COLOR CHANGE CBB20CC med = Average[20](close) dst = STD[20](close) bes = med + (2 * dst) bei = med - (2 * dst) //////////////////////////////// If close > bes then DRAWCANDLE(open,high,low,close) COLOURED(0,255,0) // vert Endif If close > med and close < bes then DRAWCANDLE(open,high,low,close) COLOURED(153,255,255) // bleu ciel Endif If close < bei then DRAWCANDLE(open,high,low,Close) COLOURED(255,0,0) // rouge endif If close < med and close > bei then DRAWCANDLE(open,high,low,Close) COLOURED(0,102,204) // bleu endif Return med as " med " , bes as " bes " , bei as " bei " |
Share this
No information on this site is investment advice or a solicitation to buy or sell any financial instrument. Past performance is not indicative of future results. Trading may expose you to risk of loss greater than your deposits and is only suitable for experienced investors who have sufficient financial means to bear such risk.
ProRealTime ITF files and other attachments :PRC is also on YouTube, subscribe to our channel for exclusive content and tutorials





Well done supertiti, nicely coded and very accurate.
Beautiful.