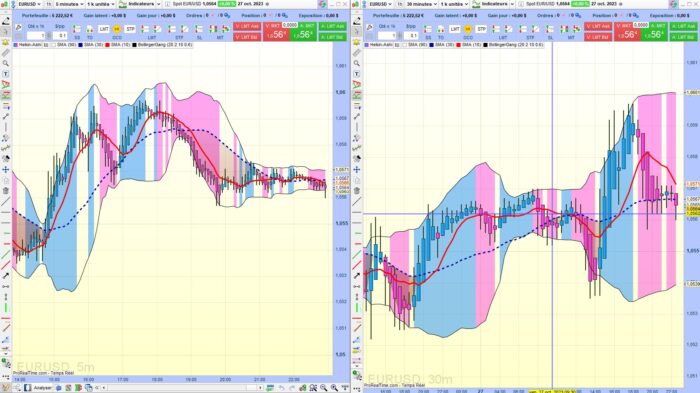
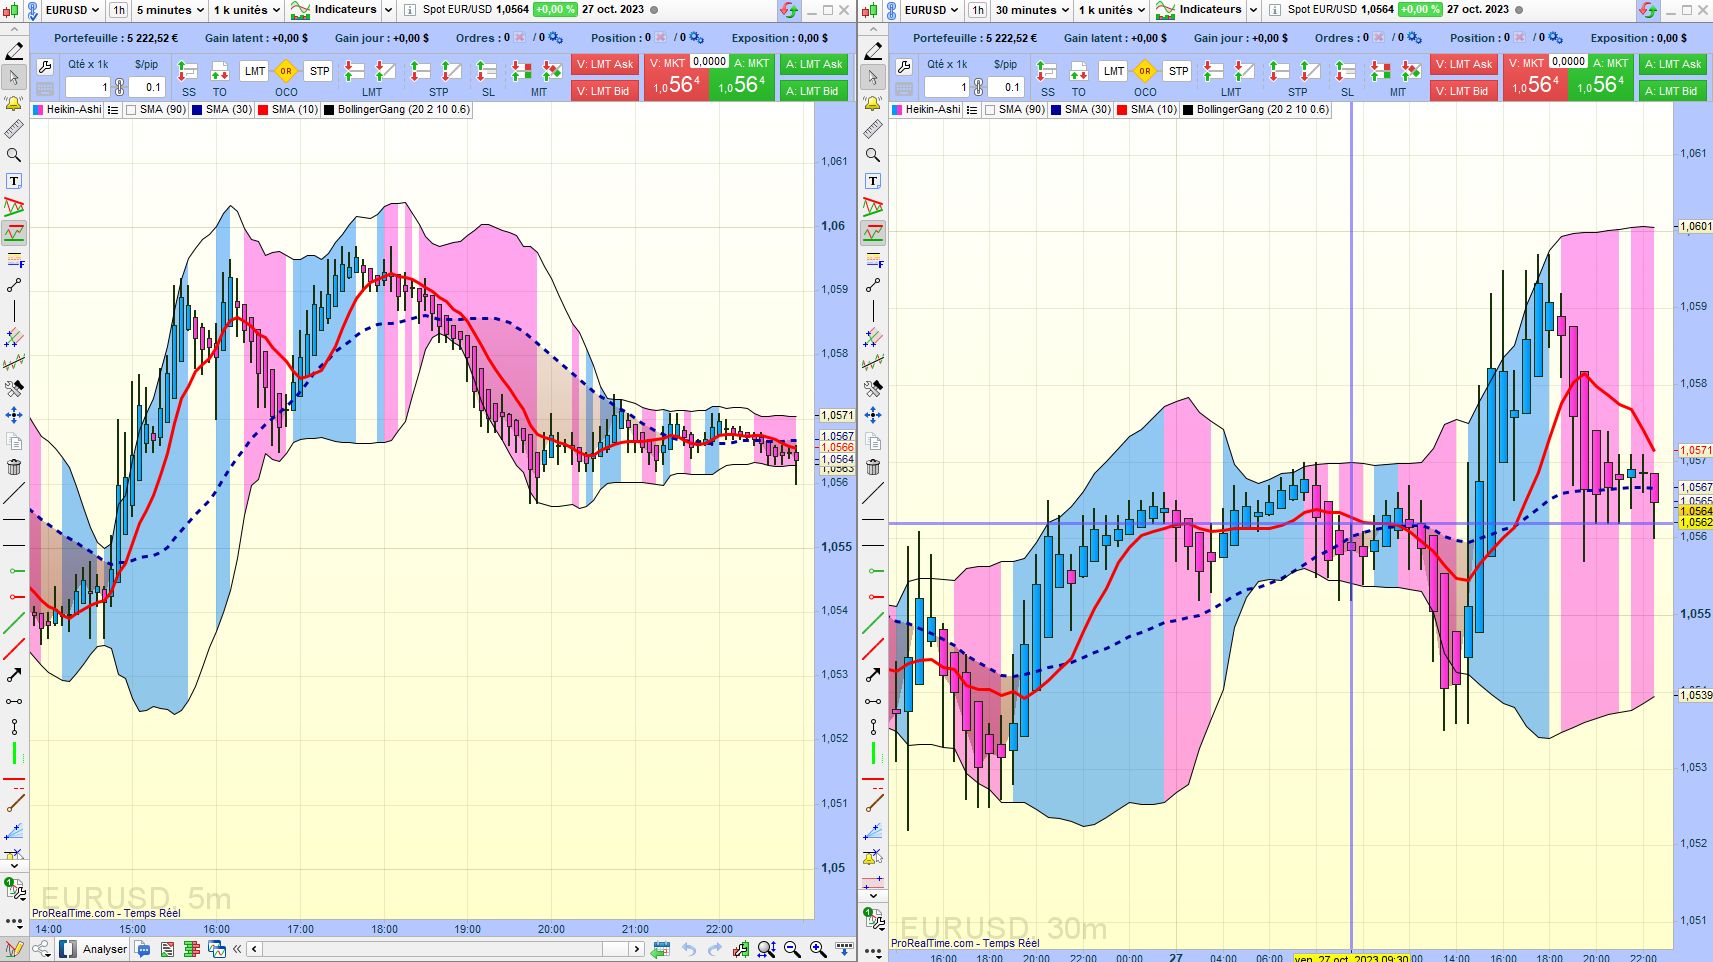
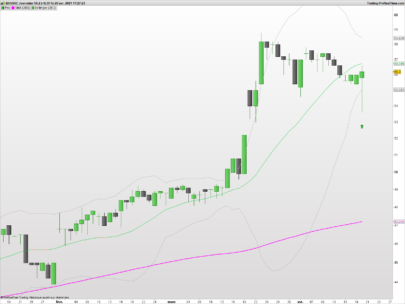
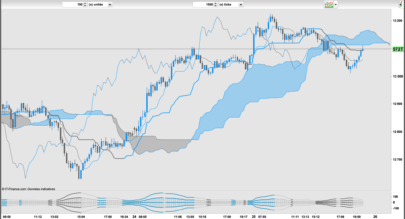
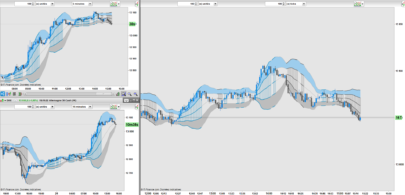
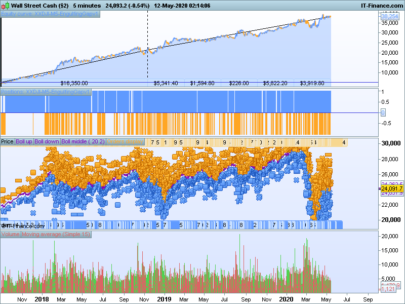
Two Bollinger Bands indicators, accomplices, linked together one into the other. One drawn, the other not drawn but coloring the first one.
The role of indicator No. 2, the one with the smallest standard deviation, is, in fact, to define a neutral zone. If one leaves it, a buy or a sell position is suggested. By playing on the period and the standard deviation of n°2, we increase or shrink the neutral zone, we lengthen
or shrink the colored zones of the first.
|
1 2 3 4 5 6 7 8 9 10 11 12 13 14 15 16 17 18 19 20 21 22 23 24 25 26 27 28 29 30 31 32 33 34 35 36 37 38 39 40 41 42 43 44 45 46 47 48 49 50 51 52 53 54 55 56 57 58 59 60 61 62 63 64 65 66 67 68 69 70 71 72 73 74 |
// G.G. le 29 octobre 2023 /* Deux indicateurs Bollinger Bands, complices, enchassés l'un dans l'autre. L'un dessiné, l'autre non dessiné mais colorant le premier. Le rôle de l'indicateur n°2, celui avec le plus petit écart-type est, en fait, de définir une zone neutre. Si l'on en sort, une prise de position à l'achat ou à la vente est suggérée. En jouant sur la période et l'écart-type du n°2, on augmmente ou on rétrécit la zone neutre, on allonge ou on rétrécit les zones colorées du premier. Two Bollinger Bands indicators, accomplices, linked together one into the other. One drawn, the other not drawn but coloring the first one. The role of indicator No. 2, the one with the smallest standard deviation, is, in fact, to define a neutral zone. If one leaves it, a buy or a sell position is suggested. By playing on the period and the standard deviation of n°2, we increase or shrink the neutral zone, we lengthen or shrink the colored zones of the first. */ // Bollinger Enveloppe MoyEnv = Average[perEnv](close) ETypeEnv = STD[perEnv](close) ligneSup = MoyEnv + nbStdEnv * ETypeEnv ligneInf = MoyEnv - nbStdEnv * ETypeEnv // Bollinger Signal MoySig = Average[perSig](close) ETypeSig = STD[perSig](close) BBupSig = MoySig + nbStdSig * ETypeSig BBdwnSig = MoySig - nbStdSig * ETypeSig // Close à l'extérieur BB signal ??? If (close >= BBupSig) then FracBolLog = 1 endif If (close < BBupSig) and (close > BBdwnSig) then FracBolLog = 0 endif If (close <= BBdwnSig) then FracBolLog = -1 endif //Coloration de l'enveloppe If FracBolLog = 1 then r = 0 g = 127 b = 255 alpha = 110 endif // bleu / rouge = impossible If FracBolLog = 0 then r = 0 g = 0 b = 0 alpha = 0 endif // blanc / bleu If FracBolLog = -1 then r = 255 g = 0 b = 227 alpha = 90 endif COLORBETWEEN(ligneSup, ligneInf,r,g,b,alpha) return ligneSup as "Bande Sup Env", ligneInf as "Bande Inf Env" |
Share this
No information on this site is investment advice or a solicitation to buy or sell any financial instrument. Past performance is not indicative of future results. Trading may expose you to risk of loss greater than your deposits and is only suitable for experienced investors who have sufficient financial means to bear such risk.
ProRealTime ITF files and other attachments :PRC is also on YouTube, subscribe to our channel for exclusive content and tutorials





hello, thank you for sharing, I’m not top strong in the programation part, there is a way to provide us with an automatic trading strategy?
Hi, With this indicator I just wanted to show the interest that can exist to synthesize the information of 2 indicators in a single image. In my example, indicator 2 can, of course, be replaced with whatever you want. Finally, to answer your question more precisely, I have not written a program for an automatic trading strategy. Sorry !
how to adapt nbStdSig values ?