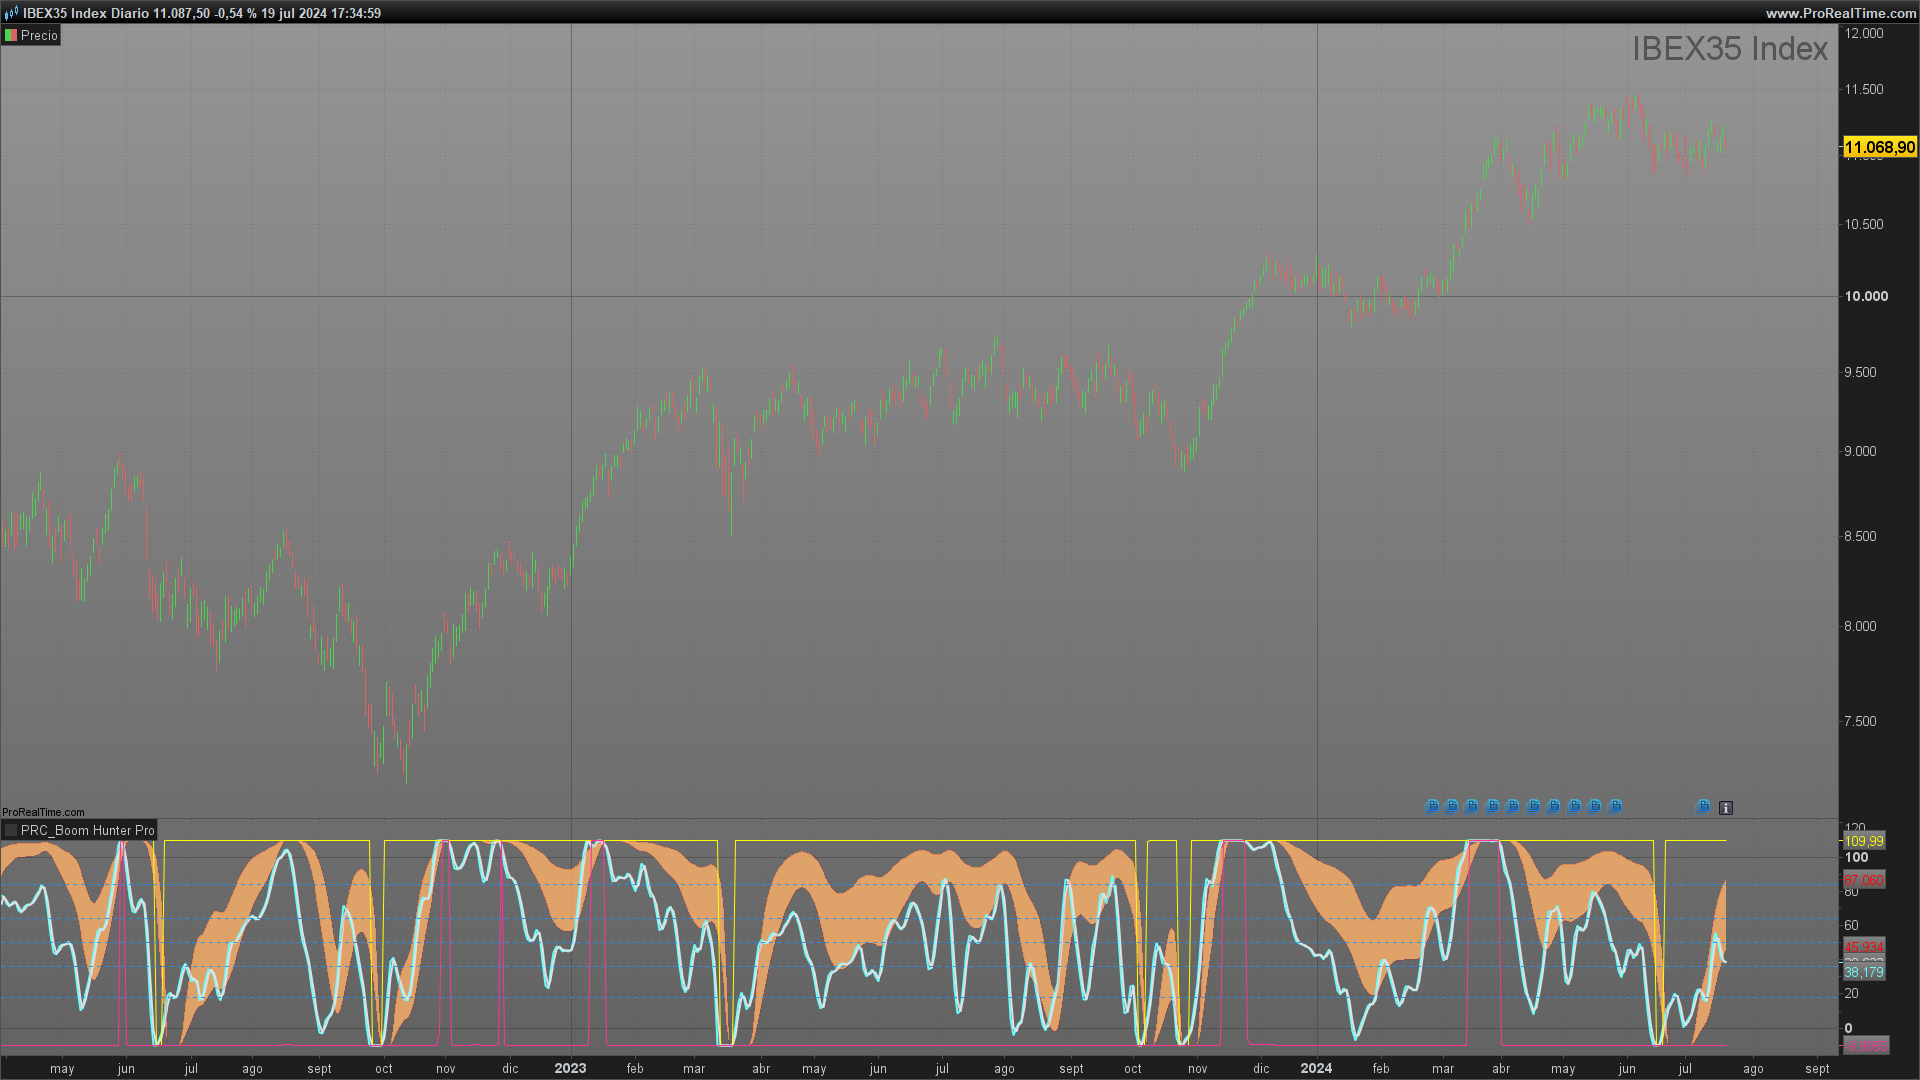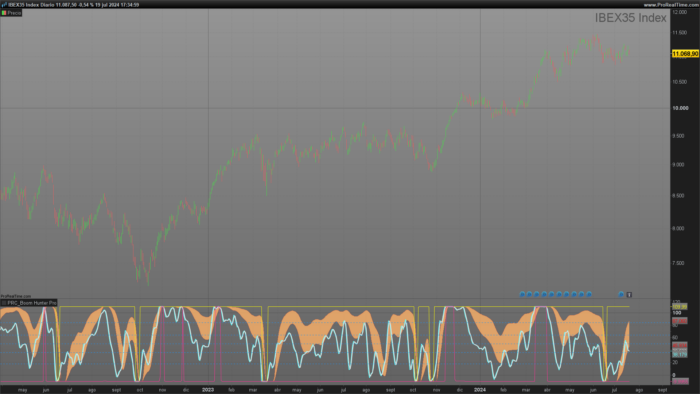
The Boom Hunter indicator is an advanced tool designed to detect potential entry and exit points in the market using three customized oscillators (EOT). This indicator combines multiple filtering and smoothing techniques to provide precise signals based on price behavior.
Indicator Components
Boom Hunter comprises several input parameters that allow users to adjust the indicator’s behavior according to their needs:
squared: Activates or deactivates the use of squared lines.showfib: Displays Fibonacci levels on the chart.- Parameters for the EOT oscillators (
lpperiod,k1,k2,esize,ey,trigno): Adjust the properties of each oscillator.
The three oscillators (EOT 1, EOT 2, and EOT 3) have specific parameters controlling their calculation period, smoothing factors, and size.
Fibonacci Levels
Fibonacci levels are a crucial part of the indicator, providing visual references on the chart that can help identify potential support and resistance zones:
|
1 2 3 4 5 6 7 |
if showfib then DRAWHLINE(84) coloured(33, 150, 243,50) style(dottedline) DRAWHLINE(64) coloured(33, 150, 243,50) style(dottedline) DRAWHLINE(50) coloured(33, 150, 243,50) style(dottedline) DRAWHLINE(36) coloured(33, 150, 243,50) style(dottedline) DRAWHLINE(18) coloured(33, 150, 243,50) style(dottedline) endif |
These levels are drawn on the chart if the
showfib option is activated.
Filter and Supersmoother Algorithm
The indicator uses a highpass filter to remove cyclic components with periods shorter than 100 bars. It then applies a supersmoother filter to smooth the data:
|
1 2 3 4 5 6 7 8 9 |
alpha1 = (cos(0.707*2*pi/100)+sin(0.707*2*pi/100)-1)/cos(0.707*2*pi/100) hp = (1-alpha1/2)*(1-alpha1/2)*(close-2*close[1]+close[2])+2*(1-alpha1)*hp[1]-(1-alpha1)*(1-alpha1)*hp[2] a1 = exp(-1.414*3.1416/lpperiod) b1 = 2*a1*cos(1.414*pi/lpperiod) c2 = b1 c3 = -a1*a1 c1 = 1-c2-c3 filt = c1*(hp+hp[1])/2+c2*filt[1]+c3[filt2] |
Fast Attack and Slow Decay Algorithm
This algorithm is used to adjust the indicator to market peaks by normalizing the roofing filter:
|
1 2 3 4 5 6 7 8 9 10 11 |
peak = 0.991*peak[1] if abs(filt) > peak then peak = abs(filt) endif if peak <> 0 then x = filt / peak endif Quotient1 = (x + k1) / (k1 * x + 1) Quotient2 = (x + k2) / (k2 * x + 1) |
EOT Oscillator 1
EOT 1 is the most precise of the three oscillators. It uses a highpass filter and a supersmoother filter, then normalizes the data and applies a fast attack and slow decay algorithm to identify market peaks.
Highpass Filter Calculation: The highpass filter removes cyclic components with periods shorter than 100 bars. This is done using the formula:
Supersmoother Filter Calculation: The supersmoother filter smooths the data using the following formula:
|
1 2 3 4 5 |
a1 = exp(-1.414*3.1416/lpperiod) b1 = 2*a1*cos(1.414*pi/lpperiod) c2 = b1 c3 = -a1*a1 c1 = 1-c2-c3 |
The result of the supersmoother filter is:
|
1 |
filt = c1*(hp+hp[1])/2+c2*filt[1]+c3*filt[2] |
Fast Attack and Slow Decay Algorithm:
|
1 2 3 4 5 6 |
peak = 0.991*peak[1] if abs(filt)>peak then peak=abs(filt) else peak=peak endif |
Roofing Filter Normalization:
|
1 2 3 4 5 |
if peak<>0 then x=filt/peak else x=x endif |
Quotient Calculation:
|
1 2 |
Quotient1 = (x+k1)/(k1*x+1) Quotient2 = (x+k2)/(k2*x+1) |
EOT Oscillator 2 and EOT Oscillator 3
EOT 2 is very interesting for analyzing the distance between its two lines. When the lines expand, it indicates a sideways market.
EOT 3 marks extremes, indicating overbought or oversold conditions.
Complete Indicator Code
Below is the complete code for the Boom Hunter indicator in ProBuilder language:
|
1 2 3 4 5 6 7 8 9 10 11 12 13 14 15 16 17 18 19 20 21 22 23 24 25 26 27 28 29 30 31 32 33 34 35 36 37 38 39 40 41 42 43 44 45 46 47 48 49 50 51 52 53 54 55 56 57 58 59 60 61 62 63 64 65 66 67 68 69 70 71 72 73 74 75 76 77 78 79 80 81 82 83 84 85 86 87 88 89 90 91 92 93 94 95 96 97 98 99 100 101 102 103 104 105 106 107 108 109 110 111 112 113 114 115 116 117 118 119 120 121 122 123 124 125 126 127 128 129 130 131 132 133 134 135 136 137 138 139 140 141 142 143 144 145 146 147 148 149 150 151 |
//----------------------------------------------------------// //PRC_Boom Hunter Pro //version = 0 //22.07.2024 //Iván González @ www.prorealcode.com //Sharing ProRealTime knowledge //----------------------------------------------------------// //-----Inputs-----------------------------------------------// squared = 1 //Square line showfib = 1 //show fibonacci //---EOT 1 Main Oscilator lpperiod = 6 //Quotient k1 = 0.00// K1 k2 = 0.3 esize = 60 // Size ey = 50 //Y axis trigno = 2 //trigger length //---EOT 2 lpperiod2 = 27 // k12 = 0.8 k22 = 0.3 esize2 = 60 ey2 = 50 //---EOT 3 lpperiod3 = 11 // k13 = 0.99 k33 = k13*(-1) esize3 = 60 ey3 = 50 if squared then k13 = 0.9999 k33 = -0.9999 endif //----------------------------------------------------------// //-----Fibonacci Levels-------------------------------------// if showfib then DRAWHLINE(84) coloured(33, 150, 243,50)style(dottedline) DRAWHLINE(64) coloured(33, 150, 243,50)style(dottedline) DRAWHLINE(50) coloured(33, 150, 243,50)style(dottedline) DRAWHLINE(36) coloured(33, 150, 243,50)style(dottedline) DRAWHLINE(18) coloured(33, 150, 243,50)style(dottedline) endif //----------------------------------------------------------// pi = 180 //-----EOT 1------------------------------------------------// if barindex > 2 then //highpass filter cyclic components //whose periods are shorter than 100 bars alpha1 = (cos(0.707*2*pi/100)+sin(0.707*2*pi/100)-1)/cos(0.707*2*pi/100) hp = (1-alpha1/2)*(1-alpha1/2)*(close-2*close[1]+close[2])+2*(1-alpha1)*hp[1]-(1-alpha1)*(1-alpha1)*hp[2] //supersmoother filter a1 = exp(-1.414*3.1416/lpperiod) b1 = 2*a1*cos(1.414*pi/lpperiod) c2 = b1 c3 = -a1*a1 c1 = 1-c2-c3 filt = c1*(hp+hp[1])/2+c2*filt[1]+c3*filt[2] //fast attack-slow decay algorithm peak = 0.991*peak[1] if abs(filt)>peak then peak=abs(filt) else peak=peak endif //normalizad roffing filter if peak<>0 then x=filt/peak else x=x endif Quotient1 = (x+k1)/(k1*x+1) Quotient2 = (x+k2)/(k2*x+1) endif //----------------------------------------------------------// //-----EOT 2------------------------------------------------// IF BARINDEX>2 THEN alpha1222 = (cos(.707 * 2 * pi / 100) + sin(.707 * 2 * pi / 100) - 1) / cos(.707 * 2 * pi / 100) HP2 = (1 - alpha1222 / 2) * (1 - alpha1222 / 2) * (close - 2 * close[1] + close[2]) + 2 * (1 - alpha1222) * HP2[1] - (1 - alpha1222) * (1 - alpha1222) * HP2[2] //----------------------------------------------------------// //SuperSmoother Filter a12 = EXP(-1.414 * 3.1416 / LPPeriod2) b12 = 2 * a12 * cos(1.414 * pi / LPPeriod2) c22 = b12 c32 = -a12 * a12 c12 = 1 - c22 - c32 Filt2 = c12 * (HP2 + HP2[1]) / 2 + c22 * Filt2[1] + c32 * Filt2[2] //Fast Attack - Slow Decay Algorithm Peak2 = .991 * Peak2[1] if abs(Filt2) > Peak2 then Peak2 = abs(Filt2) else Peak2 = peak2 endif //Normalized Roofing Filter if Peak2 <> 0 then X2 = Filt2 / Peak2 else X2 = X2 endif Quotient3 = (X2 + K12) / (K12 * X2 + 1) Quotient4 = (X2 + K22) / (K22 * X2 + 1) endif //----------------------------------------------------------// //-----EOT 3------------------------------------------------// if barindex > 2 then alpha1333 = (cos(.707 * 2 * pi / 100) + sin(.707 * 2 * pi / 100) - 1) / cos(.707 * 2 * pi / 100) HP3 = (1 - alpha1333 / 3) * (1 - alpha1333 / 2) * (close - 2 * close[1] + close[2]) + 2 * (1 - alpha1333) * HP3[1] - (1 - alpha1333) * (1 - alpha1333) * HP3[2] //SuperSmoother Filter a13 = exp(-1.414 * 3.1416 / LPPeriod3) b13 = 2 * a13 * cos(1.414 * pi / LPPeriod3) c33 = b13 c333 = -a13 * a13 c13 = 1 - c33 - c333 Filt3 = c13 * (HP3 + HP3[1]) / 2 + c33 * Filt3[1] + c333 * Filt3[2] //Fast Attack - Slow Decay Algorithm Peak3 = .991 * Peak3[1] if abs(Filt3) > Peak3 then Peak3 = abs(Filt3) else Peak3 = peak3 endif //Normalized Roofing Filter if Peak3 <> 0 then X3 = Filt3 / Peak3 else X3 = peak3 endif Quotient5 = (X3 + K13) / (K13 * X3 + 1) Quotient6 = (X3 + K33) / (K33 * X3 + 1) line1 = -0.9 endif //----------------------------------------------------------// //-----Plot EOTs--------------------------------------------// //---EOT1 q1 = Quotient1 * esize + ey q2 = Quotient2 * esize + ey trigger = average[trigno](q1) //---EOT2 q3 = Quotient3 * esize + ey q4 = Quotient4 * esize + ey colorbetween(q3,q4,255,178,105,200) //---EOT3 q5 = Quotient5 * esize2 + ey2 q6 = Quotient6 * esize2 + ey2 //----------------------------------------------------------// return q1 as "oscillator"coloured(102,255,255)style(line,2), trigger as "Trigger"coloured(224,224,224)style(line,2),q3 as "Q3"coloured("red",50), q4 as "Q4"coloured("red",50), Q5 as"q5" coloured("YELLOW") , Q6 as "q6" coloured(255,51,153) |
Share this
No information on this site is investment advice or a solicitation to buy or sell any financial instrument. Past performance is not indicative of future results. Trading may expose you to risk of loss greater than your deposits and is only suitable for experienced investors who have sufficient financial means to bear such risk.
ProRealTime ITF files and other attachments :
Find other exclusive trading pro-tools on ![]()
PRC is also on YouTube, subscribe to our channel for exclusive content and tutorials