

Boxes Trail
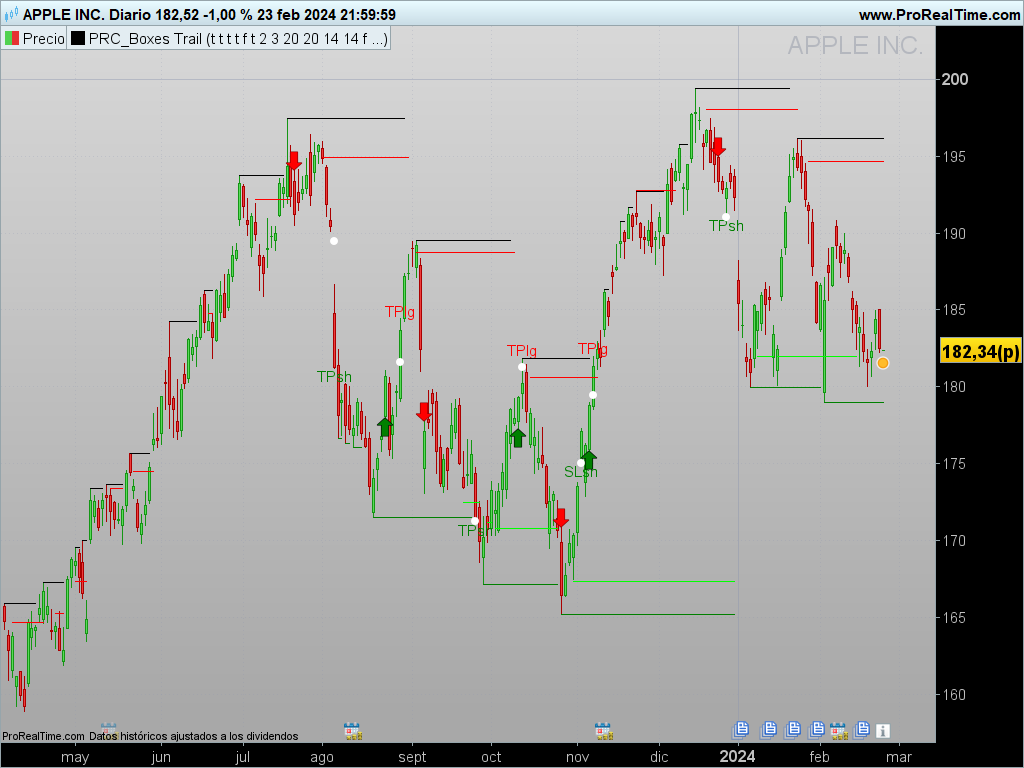
This is an indicator named Boxes Trail. It’s designed to identify trading opportunities based on the identification of dynamic support and resistance levels, in addition to applying a trading methodology trend indicators.
Here’s a summary of how it works:
Core Structure
Dynamic Support and Resistance:
It uses an approach to plot support and resistance lines based on the highest and lowest prices within a defined period (length1 for support/resistance and barlength for additional calculations). These lines dynamically adjust based on specific conditions related to price and volume.
Modified Hull Moving Average (SHMMA):
A SHMMA is calculated to identify the trend and generate buy or sell signals based on the price’s position relative to this modified average.
Trading Strategy
Entry and Exit Conditions:
The system defines specific conditions for buy (longCond) and sell (shortCond) signals, based on the crossing of dynamically calculated support and resistance lines.
Pyramiding:
Allows controlling the accumulation of positions under certain conditions, limiting the number of consecutive entries without an exit.
Risk Management:
Incorporates options to define a Take Profit (TP) and Stop Loss (SL) as a percentage of the entry price, allowing traders to secure profits and limit losses.
Climax Indicators and Market Condition
Climax Analysis:
Uses various conditions based on price analysis to classify bars into categories like climax up/down. This helps to identify the strength behind price movements and potentially predict trend changes.
Trend Conditions:
The script assesses the current market trend to adjust entry and exit strategies, as well as to optimize the placement of TP and SL orders.
Alerts and Signals
Offers the ability to generate conditional alerts for buy and sell signals, as well as for reaching TP and SL targets. This allows traders to be informed of critical moments to make decisions.
Customization and Configuration
Customizable Inputs:
Allows users to adjust various parameters, such as the length of support/resistance, the length of the SHMMA, the brick size for ATR or traditional values, and the sensitivity of entry and exit conditions.
Visualization and Overlay:
Provides options to visualize or hide certain elements on the chart, enabling users to focus on the most relevant information for their trading strategy.
This script represents a complex and customizable tool for traders looking for strategies based on dynamic support/resistance, trend and price analysis, with a focus on risk management through TP and SL. The flexibility in settings allows adapting the system to different trading styles and individual preferences.
//PRC_BOXES TRAIL
//version = 0
//26.02.24
//Iván González @ www.prorealcode.com
//Sharing ProRealTime knowledge
//////////////////////////////////////////////////
//inputs
length1 = 20 //Support / Resistance length
barlength = 20 //Bar length
length = 14 //Length
src = customclose //Source
mode = 0 //ATR or Traditional
modevalue = 14
showoverlay=0//Boolean
use2bars=0//Boolean
lookback=100

isTPl = 1 //Boolean // take profit long
isTPs = 1 //Boolean // take profit short
tp = 2 //% take profit

isSLl = 1 //Boolean // stop loss long
isSLs = 1 //Boolean // stop loss short
sl = 3 //% stop loss
//////
////Resistance lines
if high>=highest[length1](high) then
t1 = 0
top1 = high
else
top1 = top1
t1 = t1+1
drawsegment(barindex - t1,top1,barindex,top1)coloured("black")
endif
////Support lines
if low<=lowest[length1](low) then
b1 = 0
bot1 = low
else
bot1 = bot1
b1 = b1+1
drawsegment(barindex - b1,bot1,barindex,bot1)coloured("green")
endif
/////
factor = 0
slope = 0
for i=1 to length do
factor = 1+2*(i-1)
slope = slope + (src[i-1])*(length-factor)/2
next
shmma = average[length](src)+6*slope/((length+1)*length)

if shmma >= highest[barlength](shmma) then
top2 = shmma
t2 = 0
else
top2 = top2
t2 = t2+1
drawsegment(barindex-t2,top2,barindex,top2)coloured("red")
endif

if shmma <= lowest[barlength](shmma) then
bot2 = shmma
b2 = 0
else
bot2 = bot2
b2 = b2+1
drawsegment(barindex-b2,bot2,barindex,bot2)coloured("lime")
endif

////bricksize
if mode then
bricksize = averagetruerange[round(modevalue)]
else
bricksize = modevalue
endif
////
if barindex < 2 then
propen = 0
ropen = 0
rclose = 0
else
propen = ropen[1]
if close > propen+bricksize or high > propen+bricksize then
ropen = propen+bricksize
elsif close < propen-bricksize or low < propen-bricksize then
ropen = propen-bricksize
else
ropen = propen
endif

if ropen > propen then
rclose = ropen-bricksize
elsif ropen < propen then
rclose = ropen+bricksize
else
rclose = rclose[1]
endif

if ropen > propen then
direction = 1
r=0
g=255
b=0
elsif ropen < propen then
direction = -1
r=120
g=0
b=0
else
direction = direction[1]
endif
if showoverlay then
drawtext("✚",barindex,ropen)coloured(r,g,b)
drawtext("•",barindex,rclose)coloured("gray")
endif
endif
///////////
range1=high-low+0.000000001
range2=highest[2](high)-lowest[2](low)+0.000000001

if close > open and range1<>0 then
value1=(range1/(2*range1+open-close))*close
elsif close < open and range1<>0 then
value1=((range1+close-open)/(2*range1+close-open))*close
elsif close=open then
value1=close
else
value1 = value1
endif
value2=close-value1

///using only one bar
value3 = abs(value1+value2)
value4 = value1*range1
value5 = (value1-value2)*range1
value6 = value2*range1
value7 = (value2-value1)*range1

value8  = value1/range1
value9  = (value1-value2)/range1
value10 = value2/range1
value11 = (value2-value1)/range1
value12 = value3/range1

// Using two bars
if use2bars then
value13 = value3+value3[1]
value14 = (value1+value1[1])*range2
value15 = (value1+value1[1]-value2-value2[1])*range2
value16 = (value2+value2[1])*range2
value17 = (value2+value2[1]-value1-value1[1])*range2

value18 = (value1+value1[1])/range2
value19 = (value1+value1[1]-value2-value2[1])/range2
value20 = (value2+value2[1])/range2
value21 = (value2+value2[1]-value1-value1[1])/range2
value22 = value13/range2
endif
// one bar conditions
condition1 = value3 = lowest[lookback](value3)
condition2 = value4 = highest[lookback](value4) and close > open
condition3 = value5 = highest[lookback](value5) and close > open
condition4 = value6 = highest[lookback](value6) and close < open
condition5 = value7 = highest[lookback](value7) and close < open
condition6 = value8 =lowest[lookback](value8) and close < open
condition7 = value9 =lowest[lookback](value9) and close < open
condition8 = value10 =lowest[lookback](value10) and close > open
condition9 = value11 =lowest[lookback](value11) and close > open
condition10 = value12 =highest[lookback](value12)

// two bar conditions
condition11 = use2bars and value13 = lowest[lookback](value13)
condition12 = use2bars and value14 =highest[lookback](value14) and close > open and close[1] > open[1]
condition13 = use2bars and value15 =highest[lookback](value15) and close > open and close[1] > open[1]
condition14 = use2bars and value16 =highest[lookback](value16) and close < open and close[1] < open[1]
condition15 = use2bars and value17 =highest[lookback](value17) and close < open and close[1] < open[1]
condition16 = use2bars and value18 =lowest[lookback](value18) and close < open and close[1] < open[1]
condition17 = use2bars and value19 =lowest[lookback](value19) and close < open and close[1] < open[1]
condition18 = use2bars and value20 =lowest[lookback](value20) and close > open and close[1] > open[1]
condition19 = use2bars and value21 =lowest[lookback](value21) and close > open and close[1] > open[1]
condition20 = use2bars and value22 =highest[lookback](value22)

//Classifying the bars using one bar conditions, or using both one bar and two bar conditions simultaneosly if "use2bars" button selected.

lowvolume  = (condition1 or condition11)
climaxupvolume = (condition2 or condition3 or condition8 or condition9 or condition12 or condition13 or condition18 or condition19)
climaxdownvolume = (condition4 or condition5 or condition6 or condition7 or condition14 or condition15 or condition16 or condition17)
churnvolume =  (condition10 or condition20)
climaxchurnvolume =  (condition10 or condition20) and (condition2 or condition3 or condition4 or condition5 or condition6 or condition7 or condition8 or condition9 or condition12 or condition13 or condition14 or condition15 or condition16 or condition17 or condition18 or condition19)


if barindex<2 then
trend=1
supplyline=high
supportline=low
elsif close>supplyline[1] then
trend=1
elsif close<supportline[1] then
trend=-1
else
trend=trend[1]
endif

if trend=1 then
if climaxdownvolume then
supplyline=highest[2](high)
elsif high>supplyline[1] then
supplyline=high
else
supplyline=supplyline[1]
endif
else
if climaxdownvolume then
supplyline=highest[2](high)
else
supplyline=supplyline[1]
endif
endif

if trend=-1 then
if climaxupvolume then
supportline=lowest[2](low)
elsif low < supportline[1] then
supportline=low
else
supportline=supportline[1]
endif
else
if climaxupvolume then
supportline=lowest[2](low)
else
supportline=supportline[1]
endif
endif

if trend=-1 then
trailing2 = supportline
else
trailing2 = supplyline
endif
if trend=1 then
trailing1 = supportline
else
trailing1 = supplyline
endif

longcond = trailing2 crosses over trailing1
shortcond = trailing2 crosses under trailing1

if barindex < 2 then
sectionlongs=0
sectionshorts=0
else
if longcond then
sectionlongs=sectionlongs+1
sectionshorts=0
elsif shortcond then
sectionlongs=0
sectionshorts=sectionshorts+1
endif
endif

// Pyramiding

pyrl = 1

// These check to see your signal and cross references it against the pyramiding settings above

// These check to see your signal and cross references it against the pyramiding settings above

longCondition = longCond and sectionLongs <= pyrl
shortCondition = shortCond and sectionShorts <= pyrl

if barindex < 2 then
lastopenlongCondition=0
lastopenshortCondition=0
lastlongCondition = 0
lastshortCondition = 0
else
// Get the price of the last opened long or short
if longCondition then
lastopenlongCondition = open
else
lastopenlongCondition = lastopenlongCondition[1]
endif
if shortCondition then
lastopenshortCondition = open
else
lastopenshortCondition = lastopenshortCondition[1]
endif
// Check if your last postion was a long or a short
if longCondition then
lastlongCondition = barindex
else
lastlongCondition = lastlongCondition[1]
endif
if shortCondition then
lastshortCondition = barindex
else
lastshortCondition = lastshortCondition[1]
endif
endif

inlongcondition = lastlongcondition > lastshortcondition
inshortcondition = lastlongcondition < lastshortcondition

// Take profit

longTP = isTPl and high crosses over (1+(tp/100))*lastopenlongCondition and longcondition = 0 and inlongcondition
shortTP = isTPs and low crosses under (1-(tp/100))*lastopenshortCondition and shortcondition = 0 and inshortcondition

// Stop Loss

longSL = isSLl and low crosses under (1-(sl/100))*lastopenlongCondition and longcondition = 0 and inlongcondition
shortSL = isSLs and high crosses over (1+(sl/100))*lastopenshortCondition and shortcondition = 0 and inshortcondition

// Create a single close for all the different closing conditions.
if barindex < 2 then
lastlongClose = 0
lastshortClose = 0
else
if longTP or longSL then
longclose = 1
lastlongclose = barindex
else
longclose = 0
lastlongclose = lastlongclose[1]
endif
if shortTP or shortSL then
shortclose = 1
lastshortclose = barindex
else
shortclose = 0
lastshortclose = lastshortclose[1]
endif
endif

// Signals
if longcondition then
drawarrowup(barindex,low-0.15*averagetruerange[10](close))coloured("green")
elsif shortcondition then
drawarrowdown(barindex,high+0.15*averagetruerange[10](close))coloured("red")
endif

if longTP and lastlongCondition>lastlongclose[1] then
drawtext("TPlg",barindex,high+0.15*averagetruerange[10](close))coloured("red")
drawpoint(barindex,(1+(tp/100))*lastopenlongcondition,2)coloured("white")
elsif shortTP and lastshortCondition>lastshortclose[1] then
drawtext("TPsh",barindex,low-0.15*averagetruerange[10](close))coloured("green")
drawpoint(barindex,(1-(tp/100))*lastopenshortcondition,2)coloured("white")
elsif longSL and lastlongcondition>lastlongclose[1] then
drawtext("SLlg",barindex,high+0.15*averagetruerange[10](close))coloured("red")
drawpoint(barindex,(1-(sl/100))*lastopenlongcondition,2)coloured("white")
elsif shortSL and lastshortcondition>lastshortclose[1] then
drawtext("SLsh",barindex,low-0.15*averagetruerange[10](close))coloured("green")
drawpoint(barindex,(1+(sl/100))*lastopenshortcondition,2)coloured("white")
endif

return
