







Break Out Analysis Tool v3 (Update)
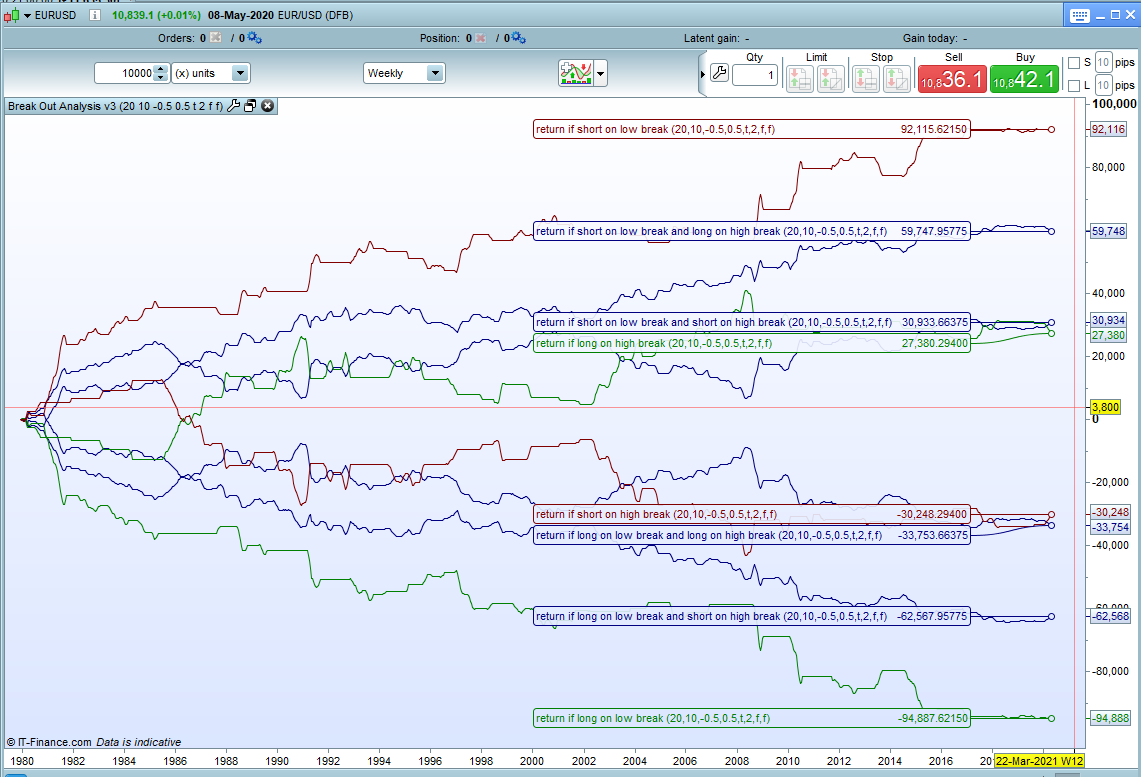
This indicator is an update to add lots of new features and improvements to my Break Out Analysis tool that can be found here:
Please read the description in that library post to understand the basics of what the tool can analyse.
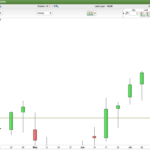
In this new version it is now possible to set the number of bars in the past that we look for our highest high and lowest low breakout levels in and to also set how many bars going forward that we look for a break of those levels in and exit the trade at the end of. ‘p’ and ‘pHold’ are the settings for this.
It is now also possible to adjust the high and low break out levels individually using the ‘HighBreakPerc’ and ‘LowBreakPerc’ settings. A positive number is above the level and a negative number below the level. So for example you can now check for breaks 1% lower than the highest high in the last p bars and 0.5% higher than the lowest low in the last p bars with settings of -1.0 and +0.5. The tool ignores any bars where the high break level is set below the open of our starting bar or where a low break level is set above the open of our starting bar. So if you get no results or very few results then you have probably moved the levels too far.
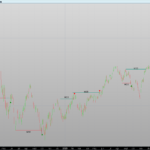
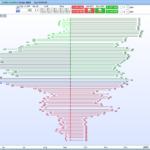
We can also now show the results for combinations of break out. So for example you can now see an equity curve for how much profit or loss you would have made if you’d gone long at every high break and short at every low break combined – and any other combination. Quantities and percentages are also shown for combinations now.
There is a setting ‘LevelStakes’ that reduces the stake size in half when viewing combined profit/loss lines so that we can directly compare them to the single breakout lines on a level playing field.
As always I advise downloading the ITF and importing to ensure that you get full functionality.
//Break Out Analysis v3
//By Vonasi
//20200510

//p = 3             //Quantity of bars used to find high break and low break levels
//pHold = 10        //Quantity of bars used to look for a break in and close trade at end of
//HighBreakPerc = 0 //Percentage above or below highest high to set break level at (+ = above hh and - = below hh)
//LowBreakPerc = 0  //Percentage above or below lowest low to set break level at (+ = above ll and - = below ll)
//Profitloss = 0    //Turn on and off profit/loss lines
//Spread = 0        //Spread to be deducted in profit/loss calculations
//LevelStakes = 1   //Use level stakes when combining breakouts
//Quantities = 0    //Turn on and off quantity of breaks lines
//Percentages = 0   //Turn on and off percentage lines

once greenperc = undefined
once redperc = undefined
once hbperc = undefined
once lbperc = undefined
once hbciperc = undefined
once lbciperc = undefined
once hbcblperc = undefined
once hbcahperc = undefined
once lbcblperc = undefined
once lbcahperc = undefined
once hbcbhperc = undefined
once hbcbhperc = undefined
once lbcalperc = undefined
once lbcalperc = undefined
once hbcahlbcalperc = undefined
once hbcahlbcblperc = undefined
once hbcbhlbcalperc = undefined
once hbcbhlbcblperc = undefined
once rlonglb = undefined
once rlonghb = undefined
once rshortlb = undefined
once rshorthb = undefined
once rlonglblonghb = undefined
once rlonglbshorthb = undefined
once rshortlblonghb = undefined
once rshortlbshorthb = undefined
once rcount = undefined
once rhb = undefined
once rlb = undefined
once rhbci = undefined
once rlbci = undefined
once rhbcbl = undefined
once rhbcah = undefined
once rlbcah = undefined
once rlbcbl = undefined
once rhbcbh = undefined
once rlbcal = undefined
once rbtot = undefined
once rhbcalbca = undefined
once rhbcblbca = undefined
once rhbcalbcb = undefined
once rhbcblbcb = undefined

hh = highest[p](high[phold]) * (1 + (highbreakperc/100))
ll = lowest[p](low[phold]) * (1 + (lowbreakperc/100))

myopen = open[phold-1]

if (myopen < hh) and (myopen > ll) then
hhao = highest[phold](high)
llao = lowest[phold](low)

if barindex > p + phold then
count = count + 1

if hhao > hh then
hb = hb + 1
if close < hh and close > ll then
hbci = hbci + 1
endif
if close > hh then
hbcah = hbcah + 1
endif
if close < ll then
hbcbl = hbcbl + 1
endif
if close < hh then
hbcbh = hbcbh + 1
endif
longhb = longhb + (close - hh)-spread
shorthb = shorthb + (hh - close)-spread
endif

if llao < ll then
lb = lb + 1
if close < hh and close > ll then
lbci = lbci + 1
endif
if close < ll then
lbcbl = lbcbl + 1
endif
if close > hh then
lbcah = lbcah + 1
endif
if close > ll then
lbcal = lbcal + 1
endif
longlb = longlb + (close - ll)-spread
shortlb = shortlb + (ll - close)-spread
endif

if close > myopen then
green = green + 1
endif

if close < myopen then
red = red + 1
endif
endif

if percentages then
greenperc = (green/count)*100
redperc = (red/count)*100
hbperc = (hb/count)*100
lbperc = (lb/count)*100
hbciperc = (hbci/hb)*100
lbciperc = (lbci/lb)*100
hbcblperc = (hbcbl/hb)*100
hbcahperc = (hbcah/hb)*100
lbcblperc = (lbcbl/lb)*100
lbcahperc = (lbcah/lb)*100
hbcbhperc = (hbcbh/hb)*100
hbcbhperc = (hbcbh/hb)*100
lbcalperc = (lbcal/lb)*100
lbcalperc = (lbcal/lb)*100
hbcahlbcalperc = (hbcahperc + lbcalperc)/2
hbcahlbcblperc = (hbcahperc + lbcblperc)/2
hbcbhlbcalperc = (hbcbhperc + lbcalperc)/2
hbcbhlbcblperc = (hbcbhperc + lbcblperc)/2
endif

if profitloss then
rlonglb = longlb
rlonghb = longhb
rshortlb = shortlb
rshorthb = shorthb
rlonglblonghb = (longlb+longhb)
rlonglbshorthb = (longlb+shorthb)
rshortlblonghb = (shortlb+longhb)
rshortlbshorthb = (shortlb+shorthb)

if levelstakes then
rlonglblonghb = rlonglblonghb/2
rlonglbshorthb = rlonglbshorthb/2
rshortlblonghb = rshortlblonghb/2
rshortlbshorthb = rshortlbshorthb/2
endif
endif

if quantities then
rcount = count
rhb = hb
rlb = lb
rhbci = hbci
rlbci = lbci
rhbcbl = hbcbl
rhbcah = hbcah
rlbcal = lbcah
rlbcbl = lbcbl
rhbcbh = hbcbh
rlbcal = lbcal
rbtot = hb + lb
rhbcalbca = rhbcah + rlbcal
rhbcblbca = rhbcbh + rlbcal
rhbcalbcb = rhbcah + rlbcbl
rhbcblbcb = rhbcbh + rlbcbl
endif
endif

return rlonglblonghb coloured(0,0,128) as "return if long on low break and long on high break",  rlonglbshorthb coloured(0,0,128) as "return if long on low break and short on high break", rshortlblonghb coloured(0,0,128) as "return if short on low break and long on high break", rshortlbshorthb coloured(0,0,128) as "return if short on low break and short on high break", greenperc coloured(0,128,0) as "% green datum" , redperc coloured(128,0,0) as "% red datum", hbperc as "% of times there is a high break out", lbperc as "% of times there is a a low break out", hbcahperc as "% of high break outs that close above high", lbcahperc as "% of low break outs that close above high", hbciperc as "% of high break outs that close inside", lbciperc as "% of low break outs that close inside", hbcblperc as "% of high break outs that close below low", lbcblperc as "% of low break outs that close below low", rlonghb coloured(0,128,0) as "return if long on high break", rshorthb coloured(128,0,0) as "return if short on high break", rlonglb coloured(0,128,0) as "return if long on low break", rshortlb coloured(128,0,0) as "return if short on low break", hbcbhperc as "% of high break outs that close below high", lbcalperc as "% of low break outs that close above low", rcount as "total qty analysed", rhb as "qty of high breaks", rlb as "qty of low breaks", rhbci as "qty of high break outs that close inside", rlbci as "qty of low break outs that close inside", rhbcbl as "qty of high break outs that close below low", rhbcah as "qty of high break outs that close above high", rlbcah as "qty of low break outs that close above high", rlbcbl as "qty of low break outs that close below low", rhbcbh as "qty of high breaks that close below high", rlbcal as "qty of low breaks that close above low", rbtot as "qty of break outs", hbcahlbcalperc as "% high breaks that close above high and low breaks that close above low combined", hbcahlbcblperc as "% high breaks that close above high and low breaks that close below low combined", hbcbhlbcalperc as "% high breaks that close below high and low breaks that close above low combined", hbcbhlbcblperc as "% high breaks that close below high and low breaks that close below low combined", rhbcalbca as "qty of high break close above and low break close above", rhbcblbca as "qty of high break close below and low break close above", rhbcalbcb as "qty of high break close above and low break close below", rhbcblbcb as "qty of high break close below and low break close below"
Comments
You must be logged in to post a comment.

I have no idea what is wrong with the posting on this website. I have problems editing posts clearly as can be seen above. Pls delete it. I only added two small paragraphs in my edit. I also cannot get the edit feature to work on other parts of this forum using either Chrome or Safari as Im using today? The add PRT code buttons has also disappeared on both browers in the last week? Hi @Vonasi, this is an excellent tool! I noticed you times by 180 and was wondering why? When I set a Dow chart to 10k units and set percent to unlikely figures like 200% it still gives a a probability of 67% long and 110% short? I also added an anchordate to get a specific lookback period (eg 10 years) using this: Please note, I am having trouble getting the Insert PRT Code not to insert html instructions within my post using Safari, (because Chrome won't let me edit posts once posted). --------------------------------------------------------------------------- "Lookback Period" AnchorDate = 20111130 //Date anchor YYYYMMDD format if date=anchordate then startbar=barindex endif lookback = max(1,barindex-startbar) if lookback>0 and date>=AnchorDate then --------------------------------------------------------------------------- Is it possible to make that as a variable integer so it can be changed easily in Settings. I added 20111130 but it's not updating the indicator when values are changed in Settings (although it works fine editing the date from within the indicator code)? I also wondered with the HighBreakPerc and LowBreakPerc feature if it will return the probability percent of, for example, the likelihood of the Dow making a 5% fall over a 15 day period? You wrote: "A positive number is above the level and a negative number below the level. So for example you can now check for breaks 1% lower than the highest high in the last p bars and 0.5% higher than the lowest low in the last p bars with settings of -1.0 and +0.5." So can it calculate breaks 6.1% higher than the highest high in the last 15 bars and also 5.1% lower than the lowest low in the last 15 bars with settings of +6.1 and -5.1 or am I misinterpreting the bit about "adjust(ing) the high and low break out levels individually?" Cheers, Bard
Hi @Vonasi, this is an excellent tool! I noticed you times by 180 and was wondering why? When I set a Dow chart to 10k units and set percent to unlikely figures like 200% it still gives a a probability of 67% long and 110% short? I also added an anchordate to get a specific lookback period (eg 10 years) using this: Please note, I am having trouble getting the Insert PRT Code not to insert html instructions within my post using Safari, (because Chrome won't let me edit posts once posted). --------------------------------------------------------------------------- "Lookback Period" AnchorDate = 20111130 //Date anchor YYYYMMDD format if date=anchordate then startbar=barindex endif lookback = max(1,barindex-startbar) if lookback>0 and date>=AnchorDate then --------------------------------------------------------------------------- Is it possible to make that as a variable integer so it can be changed easily in Settings. I added 20111130 but it's not updating the indicator when values are changed in Settings (although it works fine editing the date from within the indicator code)? I also wondered with the HighBreakPerc and LowBreakPerc feature if it will return the probability percent of, for example, the likelihood of the Dow making a 5% fall over a 15 day period? You wrote: "A positive number is above the level and a negative number below the level. So for example you can now check for breaks 1% lower than the highest high in the last p bars and 0.5% higher than the lowest low in the last p bars with settings of -1.0 and +0.5." So can it calculate breaks 6.1% higher than the highest high in the last 15 bars and also 5.1% lower than the lowest low in the last 15 bars with settings of +6.1 and -5.1 or am I misinterpreting the bit about "adjust(ing) the high and low break out levels individually?" Cheers, Bard

Hi Vonasi, thankx for the indicator I find it very usefel. I am trying to study the breakot analysis, it is a very interesting set of data. I have a doubt, I am not sure if the data of "returns" takes in account if there is an open position in the precedent candle. If not, the analysis would suppose that we have a "pseudoinfinite" amount of capital to face all the breakouts that may occur at the actual candle. For example, if our analysis takes a "p" value of 21 and "pHold" takes a value of 7, it may occur that you have several breakouts inside that pHold period, lets suppose that we have 5 breakouts inside that 7-candle period. The "return" data takes in account only the first breakout or it "opens" position in the 5 breakouts? Thanks for the work done!
And now my first post displays okay? It literally had copies of my orig post all added together about ten times in a really long comment when I edited it to add two paragraphs. Now that huge long post has gone? And now it looks like a double post! I've no idea why this has happened!?