

Buy & Sell Volume to Price Pressure
September 5, 2022, 7:50 AM
Indicators
4 Comments
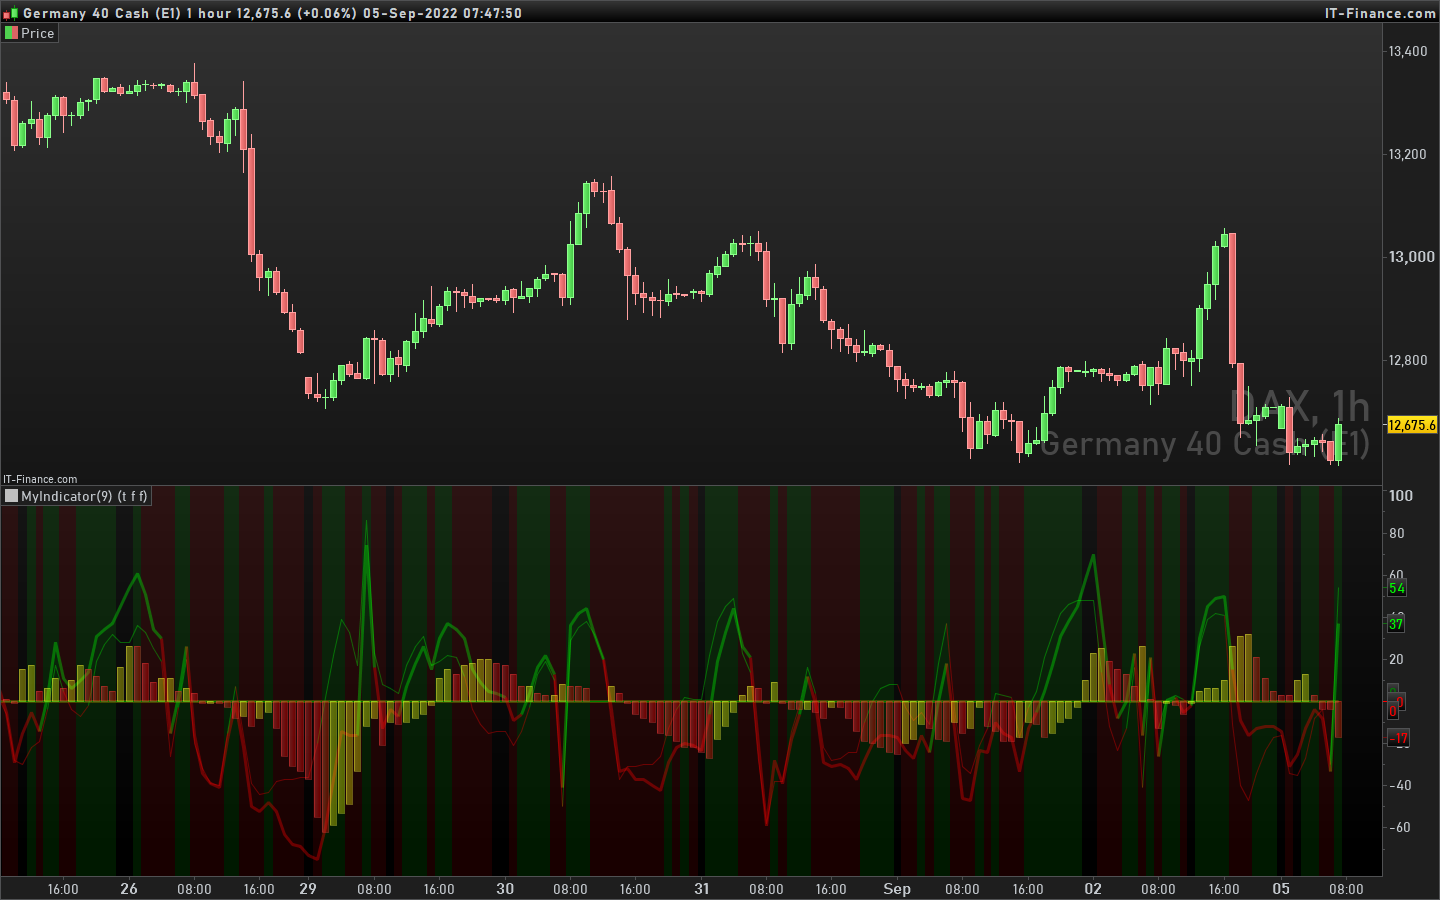
This indicator has been translated from TradingView. Credits and thanks go to the original author Ricardo M Arjona @XeL_Arjona. It compares Buying & Selling Pressure and offers 3 ways to present the result. After you import the “itf” file, you tick one of the boxes (and only one).
- “vmacd” is the option by default which presents the Buy to Sell Convergence/Div Oscillator
- “vinv” is the option which presents Buy to Sell Conv/Div as Cumulative
- “norm” is the option which presents the Normalised (Filtered) data
Detailed description by the author is in the bottom of the indicator.
Enjoy!
DEFPARAM CALCULATEONLASTBARS = 1000

// BUY & SELL VOLUME TO PRICE PRESSURE
// Ver. 1.15.b2.27.07.2015
// By Ricardo M Arjona @XeL_Arjona
// Translated from TradingView
//study("BUY & SELL VOLUME TO PRICE PRESSURE by @XeL_Arjona", shorttitle="BSVP_XeL", precision=0)
//signal = input(title="Base for FastMA Periods:", type=integer, defval=3)
//long = input(title="Buy to Sell Conv/Div Lookback:", type=integer, defval=27)
//vmacd = input(true, title="Buy to Sell Convergence/Div OSC:")
//vinv = input(false, title="Buy to Sell Conv/Div as cummulative:")
//norm = input(false, title="Normalised (Filtered) Version:")

signal = 3
long = 21
//vmacd = 1
//vinv = 0
//norm = 0


// Bull and Bear "Power-Balance" by Vadim Gimelfarb Algorithm's
if close<open then
if close[1]<open then
BP = max(high-close[1], close-low)
else
BP = max(high-open, close-low)
endif
elsif close>open then
if close[1]>open then
BP = high-low
else
BP = max(open-close[1], high-low)
endif
elsif high-close>close-low then
if close[1]<open then
BP = max(high-close[1],close-low)
else
BP = high-open
endif
elsif high-close<close-low then
if close[1]>open then
BP = high-low
else
BP = max(open-close[1], high-low)
endif
elsif close[1]>open then
BP = max(high-open, close-low)
elsif close[1]<open then
BP = max(open-close[1], high-low)
else
BP =  high-low
endif

if close<open then
if close[1]>open then
SP = max(close[1]-open, high-low)
else
SP = high-low
endif
elsif close>open then
if close[1]>open then
SP = max(close[1]-low, high-close)
else
SP = max(open-low, high-close)
endif
elsif high-close>close-low then
if close[1]>open then
SP = max(close[1]-open, high-low)
else
SP = high-low
endif
elsif high-close<close-low then
if close[1]>open then
SP = max(close[1]-low, high-close)
else
SP = open-low
endif
elsif close[1]>open then
SP = max(close[1]-open, high-low)
elsif close[1]<open then
SP = max(open-low, high-close)
else
SP = high-low
endif

TP = BP+SP

// RAW Pressure Volume Calculations
BPV = (BP/TP)*volume
SPV = (SP/TP)*volume
TPV = BPV+SPV

BPVavg = ExponentialAverage[signal](ExponentialAverage[signal](BPV)) // ema(ema(BPV,signal),signal)
SPVavg = ExponentialAverage[signal](ExponentialAverage[signal](SPV))  //ema(ema(SPV,signal),signal)
TPVavg = ExponentialAverage[signal](WeightedAverage[signal](TPV))  //ema(wma(TPV,signal),signal)

// Karthik Marar's Pressure Volume Normalized Version (XeL-MOD.)
VN = volume/ExponentialAverage[long](volume) //ema(vol,long)
BPN = ((BP/ExponentialAverage[long](BP))*VN)*100
SPN = ((SP/ExponentialAverage[long](SP))*VN)*100
TPN = BPN+SPN

nbf =  ExponentialAverage[signal](WeightedAverage[signal](BPN)) // ema(wma(BPN,signal),signal)
nsf =  ExponentialAverage[signal](WeightedAverage[signal](SPN)) //ema(wma(SPN,signal),signal)
tpf =  ExponentialAverage[signal](WeightedAverage[signal](TPN)) //ema(wma(TPN,signal),signal)
ndif = nbf-nsf

// Conditional Selectors for RAW/Norm
if BPV>SPV then
BPc1 = BPV
else
BPc1 = -abs(BPV)
endif

if BPN>SPN then
BPc2 = BPN
else
BPc2 = -abs(BPN)
endif

if SPV>BPV then
SPc1 = SPV
else
SPc1 = -abs(SPV)
endif

if SPN>BPN then
SPc2 = SPN
else
SPc2 = -abs(SPN)
endif

if norm then
BPcon = BPc2
else
BPcon = BPc1
endif

if norm then
SPcon = SPc2
else
SPcon = SPc1
endif

if norm then
BPAcon = nbf
else
BPAcon = BPVavg
endif

if norm then
SPAcon = nsf
else
SPAcon = SPVavg
endif

if norm then
TPAcon = tpf
else
TPAcon = TPVavg
endif

// Volume Pressure Convergence Divergence by XeL_Arjona
if vinv then
vpo1 = ((summation[long](BPVavg)-summation[long](SPVavg)))/(summation[long](TPVavg))*100
else
vpo1 = ((BPVavg-SPVavg)/TPVavg)*100
endif

if vinv then
vpo2 = (( summation[long](nbf)-summation[long](nsf))/summation[long](tpf))*100
else
vpo2 = ((nbf-nsf)/tpf)*100
endif

vph = (vpo1 - vpo2)

// Plot Indicator
if vph > vph[1] then
r1 = 255
g1 = 255
b1 = 0
else
r1=255
g1=0
b1=0
endif

if vpo1 > 0 then
ir2 = 0
g2=255
b2=0
else
ir2=255
g2=0
b2=0
endif

if vpo2 > 0 then
r3 = 0
g3 = 255
b3 = 0
else
r3 = 255
g3 = 0
b3 = 0
endif

if (vpo1 > vpo1[1] and vpo2 > vpo2[1]) or (BPcon > SPcon and BPAcon > SPAcon)  then
BACKGROUNDCOLOR(0,255,0,25)
endif
if (vpo1 < vpo1[1] and vpo2 < vpo2[1]) or (BPcon < SPcon and BPAcon < SPAcon) then
BACKGROUNDCOLOR(255,0,0,25)
endif

return (1-vmacd)*round(SPcon,0) style(histogram) coloured("red") as "Selling", (1-vmacd)*round(BPcon,0) style(histogram) coloured("green") as "Buying", (1-vmacd)*round(SPAcon,0) style(line,2) coloured("red") as "SPAvg", (1-vmacd)*round(BPAcon,0) style(line,2) coloured("green") as "BPAvg", (vmacd)*round(vpo1,0) style(line,3) coloured(ir2,g2,b2,90) as "VPO1", (vmacd)*round(vpo2,0) style(line,1) coloured(r3,g3,b3,90) as "VPO2", (vmacd)*round(vph,0) style(histogram) coloured(r1,g1,b1,90) as "VPH"


DISCLAIMER:
//
// The Following indicator/code IS NOT intended to be
// a formal investment advice or recommendation by the
// author, nor should be construed as such. Users
// will be fully responsible by their use regarding
// their own trading vehicles/assets.
//
// The embedded code and ideas within this work are
// FREELY AND PUBLICLY available on the Web
// for NON LUCRATIVE ACTIVITIES and must remain as is.
//
// Pine Script code MOD's and adaptations by @XeL_Arjona
// with special mention in regard of:
// + Buy (Bull) and Sell (Bear) "Power Balance Algorithm" by:
// Stocks & Commodities V. 21:10 (68-72):
// "Bull And Bear Balance Indicator by Vadim Gimelfarb"
// + Normalisation (Filter) from Karthik Marar's VSA work:
// http://karthikmarar.blogspot.mx
// + Buy to Sell Convergence / Divergence and Volume Pressure
// Conunterforce Histogram Ideas by: @XeL_Arjona
//
// WHAT IS THIS?
//
// The following indicators try to acknowledge in a K-I-S-S
// approach to the eye (Keep-It-Simple-Stupid), the two most
// important aspects of nearly every trading vehicle:
// -- PRICE ACTION IN RELATION BY IT'S VOLUME --
//
// A) Volume Pressure Histogram:
// Columns plotted in positive are considered the dominant
// Volume Force for the given period. All "negative" columns
// represents the counterforce Vol.Press against the dominant.
//
// B) Buy to Sell Convergence / Divergence:
// It's a simple adaptation of the popular "Price
// Percentage Oscillator" or MACD but taking Buying Pressure
// against Selling Pressure Averages, so given a Positive
// oscillator reading (>0) represents Bullish dominant Trend
// and a Negative reading (<0) a Bearish dominant Trend.
// Histogram is the diff between RAW Volume Pressures
// Convergence/Divergence minus Normalised ones (Signal)
// which helps as a confirmation.
//
// C) Volume bars are by default plotted from RAW Volume
// Pressure algorithms, but they can be as well filtered
// with Karthik Marar's approach against a "Total Volume
// Average" in favor to clean day to day noise like HFT.
//
// D) ALL NEW IDEAS OR MODIFICATIONS to these indicators are
// Welcome in favor to deploy a better and more accurate readings.
// I will be very glad to be notified at Twitter: @XeL_Arjona
//
// Any important addition to this work MUST REMAIN
// PUBLIC by means of CreativeCommons CC & TradingView.
// 2015
Download
Filename:
BuySell-Vol-Price-Pressure.itf
Downloads:
262
Veteran
Developer by day, aspiring writer by night. Still compiling my bio... Error 404: presentation not found.
Author’s Profile
Loading...