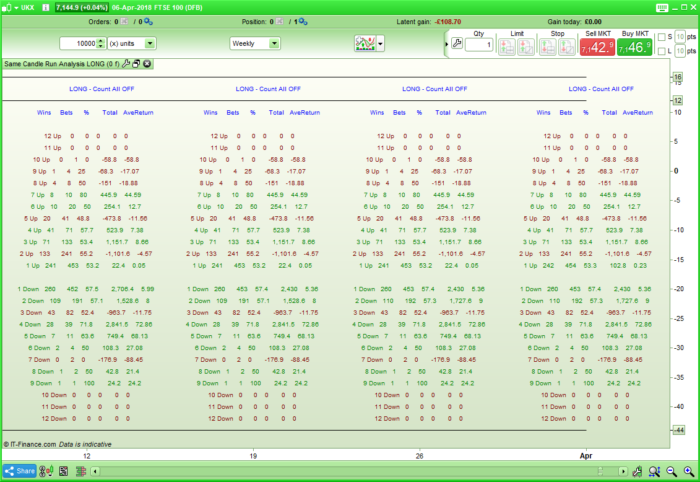
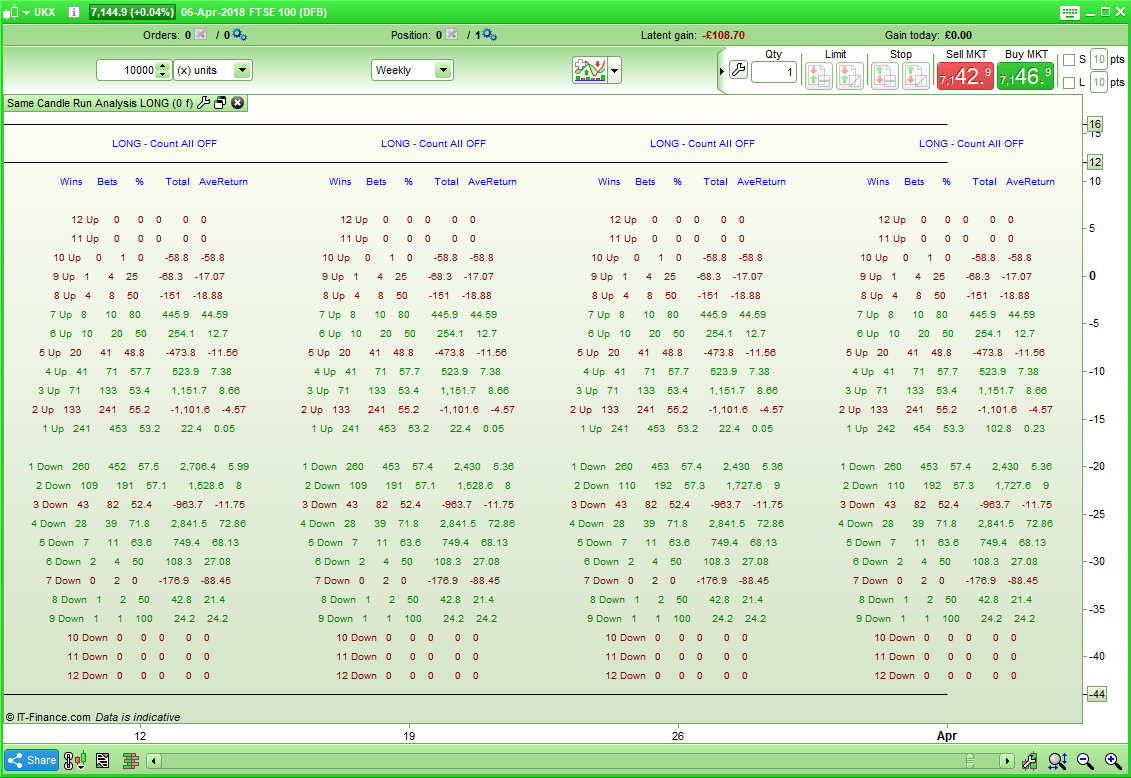
This Same Candle Run Analysis Tool can be used to analyse runs of the same colour candle in any market and on any time frame. Runs of up to 12 candles of the same colour are analysed.
It calculates a simulated result as if you placed a long trade at the close of a run of the same coloured candles and then closed it one candle later. This can give us an idea what has the highest probability of happening next based on historical data. Although it can be used on any time frame shorter time frames will be slow to calculate and the results fairly meaningless due to the amount of market noise. I would advise using it on anything from yearly to 4 hour time frames.
If you run it on multiple time frames then you can have a fairly good analysis of what is most likely to happen next. For example maybe there has been five years up in a row and the results tells us that the market is more likely to have a down year after five up years. The quarterly results might be five up in a row and the results tell us that the next candle is more likely to be a down quarter. The monthly results show that we have had one down month so it is more likely that the next is an up month but the weekly is showing three weeks down in a row and there is a 60% chance next week will be a down week. So we might look at the overall picture and decide to avoid long trades right now on that market.
The setting ‘CountAll’ can be turned on and off. If ON then the results are calculated using every occurrence of a run. For example a run of three up candles is in fact three runs of one up candle, two runs of two up candles and one run of three up candles and all will be calculated in the results. If set to OFF then just the first occurrence is used – so a run of three up candles for example must be a down candle followed by three up candles.
A spread amount can also be input and is deducted from the results of each trade. Set to zero if you do not want to analyse with spread.
The results returned are:
Wins – the number of trades that would have resulted in profit.
Bets – the total number of bets placed.
% – the percentage of wins to trades.
Total – the balance of all position outcomes.
AveReturn – the average return of all trades.
If you want to know what would have happened if you had gone short then obviously short trades would have resulted in the direct opposite results. So a 60% win rate for long trades would be a 40% win rate if you had gone short and a return of +1255 for long trades would be a loss of 1255 for short trades.
I advise making the indicator window full size and zooming in to the last candles to make the results more readable. Sorry if the columns do not line up very well but this is due to the limitations of text in PRT indicators.
I also have a version Same Candle Run Analysis Graph that returns the Total in graph format and I recommend using it alongside this tool as it allows you to easily see which results have been consistent over time.
I advise you to download the .ITF file and import it rather than cut and paste the code to ensure that you get full functionality.
|
1 2 3 4 5 6 7 8 9 10 11 12 13 14 15 16 17 18 19 20 21 22 23 24 25 26 27 28 29 30 31 32 33 34 35 36 37 38 39 40 41 42 43 44 45 46 47 48 49 50 51 52 53 54 55 56 57 58 59 60 61 62 63 64 65 66 67 68 69 70 71 72 73 74 75 76 77 78 79 80 81 82 83 84 85 86 87 88 89 90 91 92 93 94 95 96 97 98 99 100 101 102 103 104 105 106 107 108 109 110 111 112 113 114 115 116 117 118 119 120 121 122 123 124 125 126 127 128 129 130 131 132 133 134 135 136 137 138 139 140 141 142 143 144 145 146 147 148 149 150 151 152 153 154 155 156 157 158 159 160 161 162 163 164 165 166 167 168 169 170 171 172 173 174 175 176 177 178 179 180 181 182 183 184 185 186 187 188 189 190 191 192 193 194 195 196 197 198 199 200 201 202 203 204 205 206 207 208 209 210 211 212 213 214 215 216 217 218 219 220 221 222 223 224 225 226 227 228 229 230 231 232 233 234 235 236 237 238 239 240 241 242 243 244 245 246 247 248 249 250 251 252 253 254 255 256 257 258 259 260 261 262 263 264 265 266 267 268 269 270 271 272 273 274 275 276 277 278 279 280 281 282 283 284 285 286 287 288 289 290 291 292 293 294 295 296 297 298 299 300 301 302 303 304 305 306 307 308 309 310 311 312 313 314 315 316 317 318 319 320 321 322 323 324 325 326 327 328 329 330 331 332 333 334 335 336 337 338 339 340 341 342 343 344 345 346 347 348 349 350 351 352 353 354 355 356 357 358 359 360 361 362 363 364 365 366 367 368 369 370 371 372 373 374 375 376 377 378 379 380 381 382 383 384 385 386 387 388 389 390 391 392 393 394 395 396 397 398 399 400 401 402 403 404 405 406 407 408 409 410 411 412 413 414 415 416 417 418 419 420 421 422 423 424 425 426 427 428 429 430 431 432 433 434 435 436 437 438 439 440 441 442 443 444 445 446 447 448 449 450 451 452 453 454 455 456 457 458 459 460 461 462 463 464 465 466 467 468 469 470 471 472 473 474 475 476 477 478 479 480 481 482 483 484 485 486 487 488 489 490 491 492 493 494 495 496 497 498 499 500 501 502 503 504 505 506 507 508 509 510 511 512 513 514 515 516 517 518 519 520 521 522 523 524 525 526 527 528 529 530 531 532 533 534 535 536 537 538 539 540 541 542 543 544 545 546 547 548 549 550 551 552 553 554 555 556 557 558 559 560 561 562 563 564 565 566 567 568 569 570 571 572 573 574 575 576 577 578 579 580 581 582 583 584 585 586 587 588 589 590 591 592 593 594 595 596 597 598 599 600 601 602 603 604 605 606 607 608 609 610 611 612 613 614 615 616 617 618 619 620 621 622 623 624 625 626 627 628 629 630 631 632 633 634 635 636 637 638 639 640 641 642 643 644 645 646 647 648 649 650 651 652 653 654 655 656 657 658 659 660 661 662 663 664 665 666 667 668 669 670 671 672 673 674 675 676 677 678 679 680 681 682 683 684 685 686 687 688 689 690 691 692 693 694 695 696 697 698 699 700 701 702 703 704 705 706 707 708 709 710 711 712 713 714 715 716 717 718 719 720 721 722 723 724 725 726 727 728 729 730 731 732 733 734 735 736 737 738 739 740 741 742 743 744 745 746 747 748 749 750 751 752 753 754 755 756 757 758 759 760 761 762 763 764 765 766 767 768 769 770 771 772 773 774 |
//Same Candle Run Analysis Tool //Created by Vonasi //07-04-2018 IF CountAll = 1 THEN IF close > Open + Spread and close[1] < open[1] and close[2] < open[2] and close[3] < open[3] and close[4] < open[4] and close[5] < open[5] and close[6] < open[6] and close[7] < open[7] and close[8] < open[8] and close[9] < open[9] and close[10] < open[10] and close[11] < open[11] and close[12] < open[12] THEN Down12 = Down12 + 1 DownCount12 = DownCount12 + 1 Down12Total = Down12Total + (close - open) - Spread ENDIF IF close < open and close[1] < open[1] and close[2] < open[2] and close[3] < open[3] and close[4] < open[4] and close[5] < open[5] and close[6] < open[6] and close[7] < open[7] and close[8] < open[8] and close[9] < open[9] and close[10] < open[10] and close[11] < open[11] and close[12] < open[12] THEN DownCount12 = DownCount12 + 1 Down12Total = Down12Total + (close - open) - Spread ENDIF IF close > Open + Spread and close[1] < open[1] and close[2] < open[2] and close[3] < open[3] and close[4] < open[4] and close[5] < open[5] and close[6] < open[6] and close[7] < open[7] and close[8] < open[8] and close[9] < open[9] and close[10] < open[10] and close[11] < open[11] THEN Down11 = Down11 + 1 DownCount11 = DownCount11 + 1 Down11Total = Down11Total + (close - open) - Spread ENDIF IF close < open and close[1] < open[1] and close[2] < open[2] and close[3] < open[3] and close[4] < open[4] and close[5] < open[5] and close[6] < open[6] and close[7] < open[7] and close[8] < open[8] and close[9] < open[9] and close[10] < open[10] and close[11] < open[11] THEN DownCount11 = DownCount11 + 1 Down11Total = Down11Total + (close - open) - Spread ENDIF IF close > Open + Spread and close[1] < open[1] and close[2] < open[2] and close[3] < open[3] and close[4] < open[4] and close[5] < open[5] and close[6] < open[6] and close[7] < open[7] and close[8] < open[8] and close[9] < open[9] and close[10] < open[10] THEN Down10 = Down10 + 1 DownCount10 = DownCount10 + 1 Down10Total = Down10Total + (close - open) - Spread ENDIF IF close < open and close[1] < open[1] and close[2] < open[2] and close[3] < open[3] and close[4] < open[4] and close[5] < open[5] and close[6] < open[6] and close[7] < open[7] and close[8] < open[8] and close[9] < open[9] and close[10] < open[10] THEN DownCount10 = DownCount10 + 1 Down10Total = Down10Total + (close - open) - Spread ENDIF IF close > Open + Spread and close[1] < open[1] and close[2] < open[2] and close[3] < open[3] and close[4] < open[4] and close[5] < open[5] and close[6] < open[6] and close[7] < open[7] and close[8] < open[8] and close[9] < open[9] THEN Down9 = Down9 + 1 DownCount9 = DownCount9 + 1 Down9Total = Down9Total + (close - open) - Spread ENDIF IF close < open and close[1] < open[1] and close[2] < open[2] and close[3] < open[3] and close[4] < open[4] and close[5] < open[5] and close[6] < open[6] and close[7] < open[7] and close[8] < open[8] and close[9] < open[9]THEN DownCount9 = DownCount9 + 1 Down9Total = Down9Total + (close - open) - Spread ENDIF IF close > Open + Spread and close[1] < open[1] and close[2] < open[2] and close[3] < open[3] and close[4] < open[4] and close[5] < open[5] and close[6] < open[6] and close[7] < open[7] and close[8] < open[8] THEN Down8 = Down8 + 1 DownCount8 = DownCount8 + 1 Down8Total = Down8Total + (close - open) - Spread ENDIF IF close < open and close[1] < open[1] and close[2] < open[2] and close[3] < open[3] and close[4] < open[4] and close[5] < open[5] and close[6] < open[6] and close[7] < open[7] and close[8] < open[8] THEN DownCount8 = DownCount8 + 1 Down8Total = Down8Total + (close - open) - Spread ENDIF IF close > Open + Spread and close[1] < open[1] and close[2] < open[2] and close[3] < open[3] and close[4] < open[4] and close[5] < open[5] and close[6] < open[6] and close[7] < open[7] THEN Down7 = Down7 + 1 DownCount7 = DownCount7 + 1 Down7Total = Down7Total + (close - open) - Spread ENDIF IF close < open and close[1] < open[1] and close[2] < open[2] and close[3] < open[3] and close[4] < open[4] and close[5] < open[5] and close[6] < open[6] and close[7] < open[7] THEN DownCount7 = DownCount7 + 1 Down7Total = Down7Total + (close - open) - Spread ENDIF IF close > Open + Spread and close[1] < open[1] and close[2] < open[2] and close[3] < open[3] and close[4] < open[4] and close[5] < open[5] and close[6] < open[6] THEN Down6 = Down6 + 1 DownCount6 = DownCount6 + 1 Down6Total = Down6Total + (close - open) - Spread ENDIF IF close < open and close[1] < open[1] and close[2] < open[2] and close[3] < open[3] and close[4] < open[4] and close[5] < open[5] and close[6] < open[6] THEN DownCount6 = DownCount6 + 1 Down6Total = Down6Total + (close - open) - Spread ENDIF IF close > Open + Spread and close[1] < open[1] and close[2] < open[2] and close[3] < open[3] and close[4] < open[4] and close[5] < open[5] THEN Down5 = Down5 + 1 DownCount5 = DownCount5 + 1 Down5Total = Down5Total + (close - open) - Spread ENDIF IF close < open and close[1] < open[1] and close[2] < open[2] and close[3] < open[3] and close[4] < open[4] and close[5] < open[5] THEN DownCount5 = DownCount5 + 1 Down5Total = Down5Total + (close - open) - Spread ENDIF IF close > Open + Spread and close[1] < open[1] and close[2] < open[2] and close[3] < open[3] and close[4] < open[4] THEN Down4 = Down4 + 1 DownCount4 = DownCount4 + 1 Down4Total = Down4Total + (close - open) - Spread ENDIF IF close < open and close[1] < open[1] and close[2] < open[2] and close[3] < open[3] and close[4] < open[4] THEN DownCount4 = DownCount4 + 1 Down4Total = Down4Total + (close - open) - Spread ENDIF IF close > Open + Spread and close[1] < open[1] and close[2] < open[2] and close[3] < open[3] THEN Down3 = Down3 + 1 DownCount3 = DownCount3 + 1 Down3Total = Down3Total + (close - open) - Spread ENDIF IF close < open and close[1] < open[1] and close[2] < open[2] and close[3] < open[3] THEN DownCount3 = DownCount3 + 1 Down3Total = Down3Total + (close - open) - Spread ENDIF IF close > Open + Spread and close[1] < open[1] and close[2] < open[2] THEN Down2 = Down2 + 1 DownCount2 = DownCount2 + 1 Down2Total = Down2Total + (close - open) - Spread ENDIF IF close < open and close[1] < open[1] and close[2] < open[2] THEN DownCount2 = DownCount2 + 1 Down2Total = Down2Total + (close - open) - Spread ENDIF IF close > Open + Spread and close[1] < open[1] THEN Down1 = Down1 + 1 DownCount1 = DownCount1 + 1 Down1Total = Down1Total + (close - open) - Spread ENDIF IF close < open and close[1] < open[1] THEN DownCount1 = DownCount1 + 1 Down1Total = Down1Total + (close - open) - Spread ENDIF IF close > Open + Spread and close[1] > open[1] and close[2] > open[2] and close[3] > open[3] and close[4] > open[4] and close[5] > open[5] and close[6] > open[6] and close[7] > open[7] and close[8] > open[8] and close[9] > open[9] and close[10] > open[10] and close[11] > open[11] and close[12] > open[12] THEN Up12 = Up12 + 1 UpCount12 = UpCount12 + 1 Up12Total = Up12Total + (close - open) - Spread ENDIF IF close < open and close[1] > open[1] and close[2] > open[2] and close[3] > open[3] and close[4] > open[4] and close[5] > open[5] and close[6] > open[6] and close[7] > open[7] and close[8] > open[8] and close[9] > open[9] and close[10] > open[10] and close[11] > open[11] and close[12] > open[12] THEN UpCount12 = UpCount12 + 1 Up12Total = Up12Total + (close - open) - Spread ENDIF IF close > Open + Spread and close[1] > open[1] and close[2] > open[2] and close[3] > open[3] and close[4] > open[4] and close[5] > open[5] and close[6] > open[6] and close[7] > open[7] and close[8] > open[8] and close[9] > open[9] and close[10] > open[10] and close[11] > open[11] THEN Up11 = Up11 + 1 UpCount11 = UpCount11 + 1 Up11Total = Up11Total + (close - open) - Spread ENDIF IF close < open and close[1] > open[1] and close[2] > open[2] and close[3] > open[3] and close[4] > open[4] and close[5] > open[5] and close[6] > open[6] and close[7] > open[7] and close[8] > open[8] and close[9] > open[9] and close[10] > open[10] and close[11] > open[11] THEN UpCount11 = UpCount11 + 1 Up11Total = Up11Total + (close - open) - Spread ENDIF IF close > Open + Spread and close[1] > open[1] and close[2] > open[2] and close[3] > open[3] and close[4] > open[4] and close[5] > open[5] and close[6] > open[6] and close[7] > open[7] and close[8] > open[8] and close[9] > open[9] and close[10] > open[10] THEN Up10 = Up10 + 1 UpCount10 = UpCount10 + 1 Up10Total = Up10Total + (close - open) - Spread ENDIF IF close < open and close[1] > open[1] and close[2] > open[2] and close[3] > open[3] and close[4] > open[4] and close[5] > open[5] and close[6] > open[6] and close[7] > open[7] and close[8] > open[8] and close[9] > open[9] and close[10] > open[10] THEN UpCount10 = UpCount10 + 1 Up10Total = Up10Total + (close - open) - Spread ENDIF IF close > Open + Spread and close[1] > open[1] and close[2] > open[2] and close[3] > open[3] and close[4] > open[4] and close[5] > open[5] and close[6] > open[6] and close[7] > open[7] and close[8] > open[8] and close[9] > open[9] THEN Up9 = Up9 + 1 UpCount9 = UpCount9 + 1 Up9Total = Up9Total + (close - open) - Spread ENDIF IF close < open and close[1] > open[1] and close[2] > open[2] and close[3] > open[3] and close[4] > open[4] and close[5] > open[5] and close[6] > open[6] and close[7] > open[7] and close[8] > open[8] and close[9] > open[9] THEN UpCount9 = UpCount9 + 1 Up9Total = Up9Total + (close - open) - Spread ENDIF IF close > Open + Spread and close[1] > open[1] and close[2] > open[2] and close[3] > open[3] and close[4] > open[4] and close[5] > open[5] and close[6] > open[6] and close[7] > open[7] and close[8] > open[8] THEN Up8 = Up8 + 1 UpCount8 = UpCount8 + 1 Up8Total = Up8Total + (close - open) - Spread ENDIF IF close < open and close[1] > open[1] and close[2] > open[2] and close[3] > open[3] and close[4] > open[4] and close[5] > open[5] and close[6] > open[6] and close[7] > open[7] and close[8] > open[8] THEN UpCount8 = UpCount8 + 1 Up8Total = Up8Total + (close - open) - Spread ENDIF IF close > Open + Spread and close[1] > open[1] and close[2] > open[2] and close[3] > open[3] and close[4] > open[4] and close[5] > open[5] and close[6] > open[6] and close[7] > open[7] THEN Up7 = Up7 + 1 UpCount7 = UpCount7 + 1 Up7Total = Up7Total + (close - open) - Spread ENDIF IF close < open and close[1] > open[1] and close[2] > open[2] and close[3] > open[3] and close[4] > open[4] and close[5] > open[5] and close[6] > open[6] and close[7] > open[7] THEN UpCount7 = UpCount7 + 1 Up7Total = Up7Total + (close - open) - Spread ENDIF IF close > Open + Spread and close[1] > open[1] and close[2] > open[2] and close[3] > open[3] and close[4] > open[4] and close[5] > open[5] and close[6] > open[6] THEN Up6 = Up6 + 1 UpCount6 = UpCount6 + 1 Up6Total = Up6Total + (close - open) - Spread ENDIF IF close < open and close[1] > open[1] and close[2] > open[2] and close[3] > open[3] and close[4] > open[4] and close[5] > open[5] and close[6] > open[6] THEN UpCount6 = UpCount6 + 1 Up6Total = Up6Total + (close - open) - Spread ENDIF IF close > Open + Spread and close[1] > open[1] and close[2] > open[2] and close[3] > open[3] and close[4] > open[4] and close[5] > open[5] THEN Up5 = Up5 + 1 UpCount5 = UpCount5 + 1 Up5Total = Up5Total + (close - open) - Spread ENDIF IF close < open and close[1] > open[1] and close[2] > open[2] and close[3] > open[3] and close[4] > open[4] and close[5] > open[5] THEN UpCount5 = UpCount5 + 1 Up5Total = Up5Total + (close - open) - Spread ENDIF IF close > Open + Spread and close[1] > open[1] and close[2] > open[2] and close[3] > open[3] and close[4] > open[4] THEN Up4 = Up4 + 1 UpCount4 = UpCount4 + 1 Up4Total = Up4Total + (close - open) - Spread ENDIF IF close < open and close[1] > open[1] and close[2] > open[2] and close[3] > open[3] and close[4] > open[4] THEN UpCount4 = UpCount4 + 1 Up4Total = Up4Total + (close - open) - Spread ENDIF IF close > Open + Spread and close[1] > open[1] and close[2] > open[2] and close[3] > open[3] THEN Up3 = Up3 + 1 UpCount3 = UpCount3 + 1 Up3Total = Up3Total + (close - open) - Spread ENDIF IF close < open and close[1] > open[1] and close[2] > open[2] and close[3] > open[3] THEN UpCount3 = UpCount3 + 1 Up3Total = Up3Total + (close - open) - Spread ENDIF IF close > Open + Spread and close[1] > open[1] and close[2] > open[2] THEN Up2 = Up2 + 1 UpCount2 = UpCount2 + 1 Up2Total = Up2Total + (close - open) - Spread ENDIF IF close < open and close[1] > open[1] and close[2] > open[2] THEN UpCount2 = UpCount2 + 1 Up2Total = Up2Total + (close - open) - Spread ENDIF IF close > Open + Spread and close[1] > open[1] THEN Up1 = Up1 + 1 UpCount1 = UpCount1 + 1 Up1Total = Up1Total + (close - open) - Spread ENDIF IF close < open and close[1] > open[1] THEN UpCount1 = UpCount1 + 1 Up1Total = Up1Total + (close - open) - Spread ENDIF ENDIF IF CountAll <> 1 THEN IF close > Open + Spread and close[1] < open[1] and close[2] < open[2] and close[3] < open[3] and close[4] < open[4] and close[5] < open[5] and close[6] < open[6] and close[7] < open[7] and close[8] < open[8] and close[9] < open[9] and close[10] < open[10] and close[11] < open[11] and close[12] < open[12] and close[13] > open[13] THEN Down12 = Down12 + 1 DownCount12 = DownCount12 + 1 Down12Total = Down12Total + (close - open) - Spread ENDIF IF close < open and close[1] < open[1] and close[2] < open[2] and close[3] < open[3] and close[4] < open[4] and close[5] < open[5] and close[6] < open[6] and close[7] < open[7] and close[8] < open[8] and close[9] < open[9] and close[10] < open[10] and close[11] < open[11] and close[12] < open[12] and close[13] > open[13] THEN DownCount12 = DownCount12 + 1 Down12Total = Down12Total + (close - open) - Spread ENDIF IF close > Open + Spread and close[1] < open[1] and close[2] < open[2] and close[3] < open[3] and close[4] < open[4] and close[5] < open[5] and close[6] < open[6] and close[7] < open[7] and close[8] < open[8] and close[9] < open[9] and close[10] < open[10] and close[11] < open[11] and close[12] > open[12] THEN Down11 = Down11 + 1 DownCount11 = DownCount11 + 1 Down11Total = Down11Total + (close - open) - Spread ENDIF IF close < open and close[1] < open[1] and close[2] < open[2] and close[3] < open[3] and close[4] < open[4] and close[5] < open[5] and close[6] < open[6] and close[7] < open[7] and close[8] < open[8] and close[9] < open[9] and close[10] < open[10] and close[11] < open[11] and close[12] > open[12] THEN DownCount11 = DownCount11 + 1 Down11Total = Down11Total + (close - open) - Spread ENDIF IF close > Open + Spread and close[1] < open[1] and close[2] < open[2] and close[3] < open[3] and close[4] < open[4] and close[5] < open[5] and close[6] < open[6] and close[7] < open[7] and close[8] < open[8] and close[9] < open[9] and close[10] < open[10] and close[11] > open[11] THEN Down10 = Down10 + 1 DownCount10 = DownCount10 + 1 Down10Total = Down10Total + (close - open) - Spread ENDIF IF close < open and close[1] < open[1] and close[2] < open[2] and close[3] < open[3] and close[4] < open[4] and close[5] < open[5] and close[6] < open[6] and close[7] < open[7] and close[8] < open[8] and close[9] < open[9] and close[10] < open[10] and close[11] > open[11] THEN DownCount10 = DownCount10 + 1 Down10Total = Down10Total + (close - open) - Spread ENDIF IF close > Open + Spread and close[1] < open[1] and close[2] < open[2] and close[3] < open[3] and close[4] < open[4] and close[5] < open[5] and close[6] < open[6] and close[7] < open[7] and close[8] < open[8] and close[9] < open[9] and close[10] > open[10] THEN Down9 = Down9 + 1 DownCount9 = DownCount9 + 1 Down9Total = Down9Total + (close - open) - Spread ENDIF IF close < open and close[1] < open[1] and close[2] < open[2] and close[3] < open[3] and close[4] < open[4] and close[5] < open[5] and close[6] < open[6] and close[7] < open[7] and close[8] < open[8] and close[9] < open[9] and close[10] > open[10] THEN DownCount9 = DownCount9 + 1 Down9Total = Down9Total + (close - open) - Spread ENDIF IF close > Open + Spread and close[1] < open[1] and close[2] < open[2] and close[3] < open[3] and close[4] < open[4] and close[5] < open[5] and close[6] < open[6] and close[7] < open[7] and close[8] < open[8] and close[9] > open[9] THEN Down8 = Down8 + 1 DownCount8 = DownCount8 + 1 Down8Total = Down8Total + (close - open) - Spread ENDIF IF close < open and close[1] < open[1] and close[2] < open[2] and close[3] < open[3] and close[4] < open[4] and close[5] < open[5] and close[6] < open[6] and close[7] < open[7] and close[8] < open[8] and close[9] > open[9] THEN DownCount8 = DownCount8 + 1 Down8Total = Down8Total + (close - open) - Spread ENDIF IF close > Open + Spread and close[1] < open[1] and close[2] < open[2] and close[3] < open[3] and close[4] < open[4] and close[5] < open[5] and close[6] < open[6] and close[7] < open[7] and close[8] > open[8] THEN Down7 = Down7 + 1 DownCount7 = DownCount7 + 1 Down7Total = Down7Total + (close - open) - Spread ENDIF IF close < open and close[1] < open[1] and close[2] < open[2] and close[3] < open[3] and close[4] < open[4] and close[5] < open[5] and close[6] < open[6] and close[7] < open[7] and close[8] > open[8] THEN DownCount7 = DownCount7 + 1 Down7Total = Down7Total + (close - open) - Spread ENDIF IF close > Open + Spread and close[1] < open[1] and close[2] < open[2] and close[3] < open[3] and close[4] < open[4] and close[5] < open[5] and close[6] < open[6] and close[7] > open[7] THEN Down6 = Down6 + 1 DownCount6 = DownCount6 + 1 Down6Total = Down6Total + (close - open) - Spread ENDIF IF close < open and close[1] < open[1] and close[2] < open[2] and close[3] < open[3] and close[4] < open[4] and close[5] < open[5] and close[6] < open[6] and close[7] > open[7] THEN DownCount6 = DownCount6 + 1 Down6Total = Down6Total + (close - open) - Spread ENDIF IF close > Open + Spread and close[1] < open[1] and close[2] < open[2] and close[3] < open[3] and close[4] < open[4] and close[5] < open[5] and close[6] > open[6] THEN Down5 = Down5 + 1 DownCount5 = DownCount5 + 1 Down5Total = Down5Total + (close - open) - Spread ENDIF IF close < open and close[1] < open[1] and close[2] < open[2] and close[3] < open[3] and close[4] < open[4] and close[5] < open[5] and close[6] > open[6] THEN DownCount5 = DownCount5 + 1 Down5Total = Down5Total + (close - open) - Spread ENDIF IF close > Open + Spread and close[1] < open[1] and close[2] < open[2] and close[3] < open[3] and close[4] < open[4] and close[5] > open[5] THEN Down4 = Down4 + 1 DownCount4 = DownCount4 + 1 Down4Total = Down4Total + (close - open) - Spread ENDIF IF close < open and close[1] < open[1] and close[2] < open[2] and close[3] < open[3] and close[4] < open[4] and close[5] > open[5] THEN DownCount4 = DownCount4 + 1 Down4Total = Down4Total + (close - open) - Spread ENDIF IF close > Open + Spread and close[1] < open[1] and close[2] < open[2] and close[3] < open[3] and close[4] > open[4] THEN Down3 = Down3 + 1 DownCount3 = DownCount3 + 1 Down3Total = Down3Total + (close - open) - Spread ENDIF IF close < open and close[1] < open[1] and close[2] < open[2] and close[3] < open[3] and close[4] > open[4] THEN DownCount3 = DownCount3 + 1 Down3Total = Down3Total + (close - open) - Spread ENDIF IF close > Open + Spread and close[1] < open[1] and close[2] < open[2] and close[3] > open[3] THEN Down2 = Down2 + 1 DownCount2 = DownCount2 + 1 Down2Total = Down2Total + (close - open) - Spread ENDIF IF close < open and close[1] < open[1] and close[2] < open[2] and close[3] > open[3] THEN DownCount2 = DownCount2 + 1 Down2Total = Down2Total + (close - open) - Spread ENDIF IF close > Open + Spread and close[1] < open[1] and close[2] > open[2] THEN Down1 = Down1 + 1 DownCount1 = DownCount1 + 1 Down1Total = Down1Total + (close - open) - Spread ENDIF IF close < open and close[1] < open[1] and close[2] > open[2] THEN DownCount1 = DownCount1 + 1 Down1Total = Down1Total + (close - open) - Spread ENDIF IF close > Open + Spread and close[1] > open[1] and close[2] > open[2] and close[3] > open[3] and close[4] > open[4] and close[5] > open[5] and close[6] > open[6] and close[7] > open[7] and close[8] > open[8] and close[9] > open[9] and close[10] > open[10] and close[11] > open[11] and close[12] > open[12] and close[13] < open[13] THEN Up12 = Up12 + 1 UpCount12 = UpCount12 + 1 Up12Total = Up12Total + (close - open) - Spread ENDIF IF close < open and close[1] > open[1] and close[2] > open[2] and close[3] > open[3] and close[4] > open[4] and close[5] > open[5] and close[6] > open[6] and close[7] > open[7] and close[8] > open[8] and close[9] > open[9] and close[10] > open[10] and close[11] > open[11] and close[12] > open[12] and close[13] < open[13] THEN UpCount12 = UpCount12 + 1 Up12Total = Up12Total + (close - open) - Spread ENDIF IF close > Open + Spread and close[1] > open[1] and close[2] > open[2] and close[3] > open[3] and close[4] > open[4] and close[5] > open[5] and close[6] > open[6] and close[7] > open[7] and close[8] > open[8] and close[9] > open[9] and close[10] > open[10] and close[11] > open[11] and close[12] < open[12] THEN Up11 = Up11 + 1 UpCount11 = UpCount11 + 1 Up11Total = Up11Total + (close - open) - Spread ENDIF IF close < open and close[1] > open[1] and close[2] > open[2] and close[3] > open[3] and close[4] > open[4] and close[5] > open[5] and close[6] > open[6] and close[7] > open[7] and close[8] > open[8] and close[9] > open[9] and close[10] > open[10] and close[11] > open[11] and close[12] < open[12] THEN UpCount11 = UpCount11 + 1 Up11Total = Up11Total + (close - open) - Spread ENDIF IF close > Open + Spread and close[1] > open[1] and close[2] > open[2] and close[3] > open[3] and close[4] > open[4] and close[5] > open[5] and close[6] > open[6] and close[7] > open[7] and close[8] > open[8] and close[9] > open[9] and close[10] > open[10] and close[11] < open[11] THEN Up10 = Up10 + 1 UpCount10 = UpCount10 + 1 Up10Total = Up10Total + (close - open) - Spread ENDIF IF close < open and close[1] > open[1] and close[2] > open[2] and close[3] > open[3] and close[4] > open[4] and close[5] > open[5] and close[6] > open[6] and close[7] > open[7] and close[8] > open[8] and close[9] > open[9] and close[10] > open[10] and close[11] < open[11] THEN UpCount10 = UpCount10 + 1 Up10Total = Up10Total + (close - open) - Spread ENDIF IF close > Open + Spread and close[1] > open[1] and close[2] > open[2] and close[3] > open[3] and close[4] > open[4] and close[5] > open[5] and close[6] > open[6] and close[7] > open[7] and close[8] > open[8] and close[9] > open[9] and close[10] < open[10] THEN Up9 = Up9 + 1 UpCount9 = UpCount9 + 1 Up9Total = Up9Total + (close - open) - Spread ENDIF IF close < open and close[1] > open[1] and close[2] > open[2] and close[3] > open[3] and close[4] > open[4] and close[5] > open[5] and close[6] > open[6] and close[7] > open[7] and close[8] > open[8] and close[9] > open[9] and close[10] < open[10] THEN UpCount9 = UpCount9 + 1 Up9Total = Up9Total + (close - open) - Spread ENDIF IF close > Open + Spread and close[1] > open[1] and close[2] > open[2] and close[3] > open[3] and close[4] > open[4] and close[5] > open[5] and close[6] > open[6] and close[7] > open[7] and close[8] > open[8] and close[9] < open[9] THEN Up8 = Up8 + 1 UpCount8 = UpCount8 + 1 Up8Total = Up8Total + (close - open) - Spread ENDIF IF close < open and close[1] > open[1] and close[2] > open[2] and close[3] > open[3] and close[4] > open[4] and close[5] > open[5] and close[6] > open[6] and close[7] > open[7] and close[8] > open[8] and close[9] < open[9] THEN UpCount8 = UpCount8 + 1 Up8Total = Up8Total + (close - open) - Spread ENDIF IF close > Open + Spread and close[1] > open[1] and close[2] > open[2] and close[3] > open[3] and close[4] > open[4] and close[5] > open[5] and close[6] > open[6] and close[7] > open[7] and close[8] < open[8] THEN Up7 = Up7 + 1 UpCount7 = UpCount7 + 1 Up7Total = Up7Total + (close - open) - Spread ENDIF IF close < open and close[1] > open[1] and close[2] > open[2] and close[3] > open[3] and close[4] > open[4] and close[5] > open[5] and close[6] > open[6] and close[7] > open[7] and close[8] < open[8] THEN UpCount7 = UpCount7 + 1 Up7Total = Up7Total + (close - open) - Spread ENDIF IF close > Open + Spread and close[1] > open[1] and close[2] > open[2] and close[3] > open[3] and close[4] > open[4] and close[5] > open[5] and close[6] > open[6] and close[7] < open[7] THEN Up6 = Up6 + 1 UpCount6 = UpCount6 + 1 Up6Total = Up6Total + (close - open) - Spread ENDIF IF close < open and close[1] > open[1] and close[2] > open[2] and close[3] > open[3] and close[4] > open[4] and close[5] > open[5] and close[6] > open[6] and close[7] < open[7] THEN UpCount6 = UpCount6 + 1 Up6Total = Up6Total + (close - open) - Spread ENDIF IF close > Open + Spread and close[1] > open[1] and close[2] > open[2] and close[3] > open[3] and close[4] > open[4] and close[5] > open[5] and close[6] < open[6] THEN Up5 = Up5 + 1 UpCount5 = UpCount5 + 1 Up5Total = Up5Total + (close - open) - Spread ENDIF IF close < open and close[1] > open[1] and close[2] > open[2] and close[3] > open[3] and close[4] > open[4] and close[5] > open[5] and close[6] < open[6] THEN UpCount5 = UpCount5 + 1 Up5Total = Up5Total + (close - open) - Spread ENDIF IF close > Open + Spread and close[1] > open[1] and close[2] > open[2] and close[3] > open[3] and close[4] > open[4] and close[5] < open[5] THEN Up4 = Up4 + 1 UpCount4 = UpCount4 + 1 Up4Total = Up4Total + (close - open) - Spread ENDIF IF close < open and close[1] > open[1] and close[2] > open[2] and close[3] > open[3] and close[4] > open[4] and close[5] < open[5] THEN UpCount4 = UpCount4 + 1 Up4Total = Up4Total + (close - open) - Spread ENDIF IF close > Open + Spread and close[1] > open[1] and close[2] > open[2] and close[3] > open[3] and close[4] < open[4] THEN Up3 = Up3 + 1 UpCount3 = UpCount3 + 1 Up3Total = Up3Total + (close - open) - Spread ENDIF IF close < open and close[1] > open[1] and close[2] > open[2] and close[3] > open[3] and close[4] < open[4] THEN UpCount3 = UpCount3 + 1 Up3Total = Up3Total + (close - open) - Spread ENDIF IF close > Open + Spread and close[1] > open[1] and close[2] > open[2] and close[3] < open[3] THEN Up2 = Up2 + 1 UpCount2 = UpCount2 + 1 Up2Total = Up2Total + (close - open) - Spread ENDIF IF close < open and close[1] > open[1] and close[2] > open[2] and close[3] < open[3]THEN UpCount2 = UpCount2 + 1 Up2Total = Up2Total + (close - open) - Spread ENDIF IF close > Open + Spread and close[1] > open[1] and close[2] < open[2] THEN Up1 = Up1 + 1 UpCount1 = UpCount1 + 1 Up1Total = Up1Total + (close - open) - Spread ENDIF IF close < open and close[1] > open[1] and close[2] < open[2] THEN UpCount1 = UpCount1 + 1 Up1Total = Up1Total + (close - open) - Spread ENDIF ENDIF DownPerc12 = Round((Down12/DownCount12)*1000)/10 DownPerc11 = Round((Down11/DownCount11)*1000)/10 DownPerc10 = Round((Down10/DownCount10)*1000)/10 DownPerc9 = Round((Down9/DownCount9)*1000)/10 DownPerc8 = Round((Down8/DownCount8)*1000)/10 DownPerc7 = Round((Down7/DownCount7)*1000)/10 DownPerc6 = Round((Down6/DownCount6)*1000)/10 DownPerc5 = Round((Down5/DownCount5)*1000)/10 DownPerc4 = Round((Down4/DownCount4)*1000)/10 DownPerc3 = Round((Down3/DownCount3)*1000)/10 DownPerc2 = Round((Down2/DownCount2)*1000)/10 DownPerc1 = Round((Down1/DownCount1)*1000)/10 UpPerc12 = Round((Up12/UpCount12)*1000)/10 UpPerc11 = Round((Up11/UpCount11)*1000)/10 UpPerc10 = Round((Up10/UpCount10)*1000)/10 UpPerc9 = Round((Up9/UpCount9)*1000)/10 UpPerc8 = Round((Up8/UpCount8)*1000)/10 UpPerc7 = Round((Up7/UpCount7)*1000)/10 UpPerc6 = Round((Up6/UpCount6)*1000)/10 UpPerc5 = Round((Up5/UpCount5)*1000)/10 UpPerc4 = Round((Up4/UpCount4)*1000)/10 UpPerc3 = Round((Up3/UpCount3)*1000)/10 UpPerc2 = Round((Up2/UpCount2)*1000)/10 UpPerc1 = Round((Up1/UpCount1)*1000)/10 Down12AveRet = (Round((Down12Total / DownCount12)*100))/100 Down11AveRet = (Round((Down11Total / DownCount11)*100))/100 Down10AveRet = (Round((Down10Total / DownCount10)*100))/100 Down9AveRet = (Round((Down9Total / DownCount9)*100))/100 Down8AveRet = (Round((Down8Total / DownCount8)*100))/100 Down7AveRet = (Round((Down7Total / DownCount7)*100))/100 Down6AveRet = (Round((Down6Total / DownCount6)*100))/100 Down5AveRet = (Round((Down5Total / DownCount5)*100))/100 Down4AveRet = (Round((Down4Total / DownCount4)*100))/100 Down3AveRet = (Round((Down3Total / DownCount3)*100))/100 Down2AveRet = (Round((Down2Total / DownCount2)*100))/100 Down1AveRet = (Round((Down1Total / DownCount1)*100))/100 Up12AveRet = (Round((Up12Total / UpCount12)*100))/100 Up11AveRet = (Round((Up11Total / UpCount11)*100))/100 Up10AveRet = (Round((Up10Total / UpCount10)*100))/100 Up9AveRet = (Round((Up9Total / UpCount9)*100))/100 Up8AveRet = (Round((Up8Total / UpCount8)*100))/100 Up7AveRet = (Round((Up7Total / UpCount7)*100))/100 Up6AveRet = (Round((Up6Total / UpCount6)*100))/100 Up5AveRet = (Round((Up5Total / UpCount5)*100))/100 Up4AveRet = (Round((Up4Total / UpCount4)*100))/100 Up3AveRet = (Round((Up3Total / UpCount3)*100))/100 Up2AveRet = (Round((Up2Total / UpCount2)*100))/100 Up1AveRet = (Round((Up1Total / UpCount1)*100))/100 IF Down1AveRet > 0 THEN Down1R = 0 Down1G = 128 ELSE Down1R = 128 Down1G = 0 ENDIF IF Down2AveRet > 0 THEN Down2R = 0 Down2G = 128 ELSE Down2R = 128 Down2G = 0 ENDIF IF Down3AveRet > 0 THEN Down3R = 0 Down3G = 128 ELSE Down3R = 128 Down3G = 0 ENDIF IF Down4AveRet > 0 THEN Down4R = 0 Down4G = 128 ELSE Down4R = 128 Down4G = 0 ENDIF IF Down5AveRet > 0 THEN Down5R = 0 Down5G = 128 ELSE Down5R = 128 Down5G = 0 ENDIF IF Down6AveRet > 0 THEN Down6R = 0 Down6G = 128 ELSE Down6R = 128 Down6G = 0 ENDIF IF Down7AveRet > 0 THEN Down7R = 0 Down7G = 128 ELSE Down7R = 128 Down7G = 0 ENDIF IF Down8AveRet > 0 THEN Down8R = 0 Down8G = 128 ELSE Down8R = 128 Down8G = 0 ENDIF IF Down9AveRet > 0 THEN Down9R = 0 Down9G = 128 ELSE Down9R = 128 Down9G = 0 ENDIF IF Down10AveRet > 0 THEN Down10R = 0 Down10G = 128 ELSE Down10R = 128 Down10G = 0 ENDIF IF Down11AveRet > 0 THEN Down11R = 0 Down11G = 128 ELSE Down11R = 128 Down11G = 0 ENDIF IF Down12AveRet > 0 THEN Down12R = 0 Down12G = 128 ELSE Down12R = 128 Down12G = 0 ENDIF IF Up1AveRet > 0 THEN Up1R = 0 Up1G = 128 ELSE Up1R = 128 Up1G = 0 ENDIF IF Up2AveRet > 0 THEN Up2R = 0 Up2G = 128 ELSE Up2R = 128 Up2G = 0 ENDIF IF Up3AveRet > 0 THEN Up3R = 0 Up3G = 128 ELSE Up3R = 128 Up3G = 0 ENDIF IF Up4AveRet > 0 THEN Up4R = 0 Up4G = 128 ELSE Up4R = 128 Up4G = 0 ENDIF IF Up5AveRet > 0 THEN Up5R = 0 Up5G = 128 ELSE Up5R = 128 Up5G = 0 ENDIF IF Up6AveRet > 0 THEN Up6R = 0 Up6G = 128 ELSE Up6R = 128 Up6G = 0 ENDIF IF Up7AveRet > 0 THEN Up7R = 0 Up7G = 128 ELSE Up7R = 128 Up7G = 0 ENDIF IF Up8AveRet > 0 THEN Up8R = 0 Up8G = 128 ELSE Up8R = 128 Up8G = 0 ENDIF IF Up9AveRet > 0 THEN Up9R = 0 Up9G = 128 ELSE Up9R = 128 Up9G = 0 ENDIF IF Up10AveRet > 0 THEN Up10R = 0 Up10G = 128 ELSE Up10R = 128 Up10G = 0 ENDIF IF Up11AveRet > 0 THEN Up11R = 0 Up11G = 128 ELSE Up11R = 128 Up11G = 0 ENDIF IF Up12AveRet > 0 THEN Up12R = 0 Up12G = 128 ELSE Up12R = 128 Up12G = 0 ENDIF IF CountAll = 1 THEN DrawText(" LONG - Count All ON",barindex,14,SansSerif,Standard,10)coloured(0,0,255) ELSE DrawText(" LONG - Count All OFF",barindex,14,SansSerif,Standard,10)coloured(0,0,255) ENDIF DrawText(" Wins Bets % Total AveReturn",barindex,10,SansSerif,Standard,10)coloured(0,0,255) DrawText("12 Up #Up12# #UpCount12# #UpPerc12# #Up12Total# #Up12AveRet#",barindex,6,SansSerif,Standard,10)coloured(Up12R,Up12G,0) DrawText("11 Up #Up11# #UpCount11# #UpPerc11# #Up11Total# #Up11AveRet#",barindex,4,SansSerif,Standard,10)coloured(Up11R,Up11G,0) DrawText("10 Up #Up10# #UpCount10# #UpPerc10# #Up10Total# #Up10AveRet#",barindex,2,SansSerif,Standard,10)coloured(Up10R,Up10G,0) DrawText("9 Up #Up9# #UpCount9# #UpPerc9# #Up9Total# #Up9AveRet#",barindex,0,SansSerif,Standard,10)coloured(Up9R,Up9G,0) DrawText("8 Up #Up8# #UpCount8# #UpPerc8# #Up8Total# #Up8AveRet#",barindex,-2,SansSerif,Standard,10)coloured(Up8R,Up8G,0) DrawText("7 Up #Up7# #UpCount7# #UpPerc7# #Up7Total# #Up7AveRet#",barindex,-4,SansSerif,Standard,10)coloured(Up7R,Up7G,0) DrawText("6 Up #Up6# #UpCount6# #UpPerc6# #Up6Total# #Up6AveRet#",barindex,-6,SansSerif,Standard,10)coloured(Up6R,Up6G,0) DrawText("5 Up #Up5# #UpCount5# #UpPerc5# #Up5Total# #Up5AveRet#",barindex,-8,SansSerif,Standard,10)coloured(Up5R,Up5G,0) DrawText("4 Up #Up4# #UpCount4# #UpPerc4# #Up4Total# #Up4AveRet#",barindex,-10,SansSerif,Standard,10)coloured(Up4R,Up4G,0) DrawText("3 Up #Up3# #UpCount3# #UpPerc3# #Up3Total# #Up3AveRet#",barindex,-12,SansSerif,Standard,10)coloured(Up3R,Up3G,0) DrawText("2 Up #Up2# #UpCount2# #UpPerc2# #Up2Total# #Up2AveRet#",barindex,-14,SansSerif,Standard,10)coloured(Up2R,Up2G,0) DrawText("1 Up #Up1# #UpCount1# #UpPerc1# #Up1Total# #Up1AveRet#",barindex,-16,SansSerif,Standard,10)coloured(Up1R,Up1G,0) DrawText("1 Down #Down1# #DownCount1# #DownPerc1# #Down1Total# #Down1AveRet#",barindex,-20,SansSerif,Standard,10)coloured(Down1R,Down1G,0) DrawText("2 Down #Down2# #DownCount2# #DownPerc2# #Down2Total# #Down2AveRet#",barindex,-22,SansSerif,Standard,10)coloured(Down2R,Down2G,0) DrawText("3 Down #Down3# #DownCount3# #DownPerc3# #Down3Total# #Down3AveRet#",barindex,-24,SansSerif,Standard,10)coloured(Down3R,Down3G,0) DrawText("4 Down #Down4# #DownCount4# #DownPerc4# #Down4Total# #Down4AveRet#",barindex,-26,SansSerif,Standard,10)coloured(Down4R,Down4G,0) DrawText("5 Down #Down5# #DownCount5# #DownPerc5# #Down5Total# #Down5AveRet#",barindex,-28,SansSerif,Standard,10)coloured(Down5R,Down5G,0) DrawText("6 Down #Down6# #DownCount6# #DownPerc6# #Down6Total# #Down6AveRet#",barindex,-30,SansSerif,Standard,10)coloured(Down6R,Down6G,0) DrawText("7 Down #Down7# #DownCount7# #DownPerc7# #Down7Total# #Down7AveRet#",barindex,-32,SansSerif,Standard,10)coloured(Down7R,Down7G,0) DrawText("8 Down #Down8# #DownCount8# #DownPerc8# #Down8Total# #Down8AveRet#",barindex,-34,SansSerif,Standard,10)coloured(Down8R,Down8G,0) DrawText("9 Down #Down9# #DownCount9# #DownPerc9# #Down9Total# #Down9AveRet#",barindex,-36,SansSerif,Standard,10)coloured(Down9R,Down9G,0) DrawText("10 Down #Down10# #DownCount10# #DownPerc10# #Down10Total# #Down10AveRet#",barindex,-38,SansSerif,Standard,10)coloured(Down10R,Down10G,0) DrawText("11 Down #Down11# #DownCount11# #DownPerc11# #Down11Total# #Down11AveRet#",barindex,-40,SansSerif,Standard,10)coloured(Down11R,Down11G,0) DrawText("12 Down #Down12# #DownCount12# #DownPerc12# #Down12Total# #Down12AveRet#",barindex,-42,SansSerif,Standard,10)coloured(Down12R,Down12G,0) Hi2 = 16 Hi = 12 Lo = -44 Return Hi,Lo,Hi2 |
Share this
No information on this site is investment advice or a solicitation to buy or sell any financial instrument. Past performance is not indicative of future results. Trading may expose you to risk of loss greater than your deposits and is only suitable for experienced investors who have sufficient financial means to bear such risk.
ProRealTime ITF files and other attachments :
Find other exclusive trading pro-tools on ![]()
PRC is also on YouTube, subscribe to our channel for exclusive content and tutorials


I was talking to a Machine Learning coder today who’s algos have apparently managed to get 70% accuracy on predicting Bitcoin prices. It got me thinking about your Candle Run analysis. Then I thought of the Heikin Ashi charts (and Renko) that I’ve been looking at lately – both with Joseph Nemeth who uses HA entries and this Heikin Ashi Trend strength screener: https://www.prorealcode.com/prorealtime-market-screeners/heikin-ashi-trend/
(I can’t link using Safari as the page jumps around when hitting the link button)
I was wondering how easy would it be to convert this very interesting code you have to HA?
I mean can you added something like:
Close = Close = (Open+High+Low+Close)/4
Open = (Open + Close) / 2 ?
(Ps/ I also can’t add code using Safari and PRC Add PRT code)
Cheers!
Bard